THE RISE OF SPX AND 0DTE OPTIONS – Download whitepaper now

Benefits of SPX Options
- Cash Settlement & European Exercise
- Trading account credited/debited in cash, no delivery of unwanted shares or market exposure. European style is only exercised at expiration, eliminating risk of early assignment
- Certainty of Settlement, No Contra-Exercise Risk
- Cash settled European style options exercise at expiration, unlike American style, which may be exercised OTM after market close — eliminating potential economic and tax risk for writers
- Covered Margin Treatment
- Offset SPY or IVV ETF exposure on a "covered" basis in a margin account**
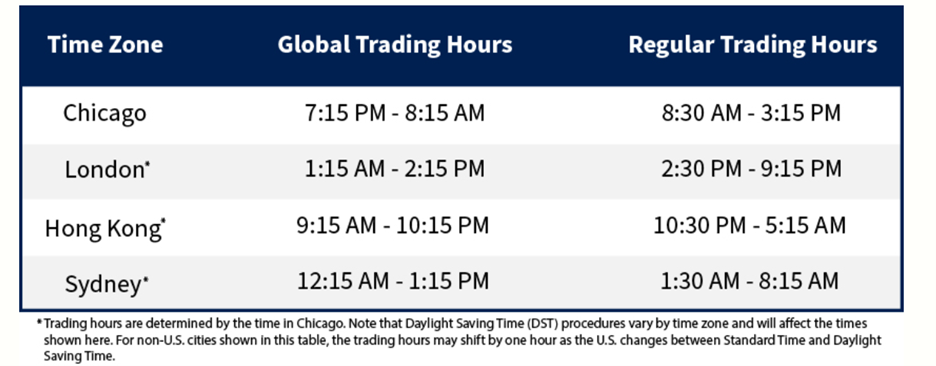
- Global Trading Hours
- Unlike ETF options, SPX options trade extended hours from 8:15 p.m. to 9:15 a.m. ET. View Global Trading Hours.*
- Contract & Notional Size Flexibility
- Choose A.M. or P.M.-settled contracts; standard, weekly or month-end expirations; or customize your own with FLEX. Trade standard S&P 500 Index options (SPX) or Minis (XSP) at 1/10th the size, or Nanos at 1/100th the size of XSP
- S&P 500 Inverse Relationship with the VIX® Index
- Expected volatility typically increases when markets are turbulent. In contrast, if stock prices are rising the VIX Index generally tends to fall or remain steady. Learn More.
- 60/40 Tax Treatment
- Capital gains may benefit from 60/40 tax treatment***
Extended Global Trading Hours
Cboe Options Exchange has extended global trading hours (GTH) for S&P 500® Index (SPX) options, Cboe Volatility Index® (VIX) options and Mini-SPX Index (XSP) options to nearly 24 hours a day, five days a week. Trade or hedge broad U.S. market and global equity volatility conveniently across all time zones, day and night.
Trading SPX Options
S&P 500 Index Options
Market Data

Select Research
Options-Based Benchmark Indexes: Performance, Risk and Premium Capture
Wilshire Associates
The inclusion of research not conducted or explicitly endorsed by Cboe should not be construed as an endorsement or indication of the value of any research.
* Global Trading Hours (GTH) The trading hours for options on the SPX, SPXW (SPX Weeklys and SPX End-of-Month), and XSP (Mini-SPX) begin at 8:15 p.m. Eastern time and end at 9:15 a.m. Eastern time. Please visit the Global Trading Hours page for more details.
** Cboe Regulatory Circular RG15-183 notes that Cboe rules allow a short position in a cash-settled-index option established and carried in a margin account to receive covered margin treatment if the short option position is offset in the same account by an equivalent or greater position in an index-tracking ETF that is based on the same index that underlies the short option(s) and provided the investor's brokerage firm has such policies in place.
*** Under section 1256 of the Tax Code, profit and loss on transactions in certain exchange-traded options, including SPX Options, are entitled to be taxed at a rate equal to 60% long-term and 40% short-term capital gain or loss, provided that the investor involved and the strategy employed satisfy the criteria of the Tax Code. Investors should consult with their tax advisors to determine how the profit and loss on any particular option strategy will be taxed. Tax laws and regulations change from time to time and may be subject to varying interpretations.
**** In the case of a holiday on the settlement date, the settlement date is moved back one business day (e.g. from Friday to Thursday), with the exception of Monday Weeklys, where the settlement date will move forward one business day (i.e. Monday to Tuesday). In addition, no SPX EOW, Monday Weeklys, Tuesday Weeklys, Wednesday Weeklys or Thursday Weeklys will be listed that would have an expiration date that coincides with the expiration date of a traditional SPX option or SPX EOM option.
The information on this website is provided for general education and information purposes only. No statement(s) within this website should be construed as a recommendation to buy or sell a security or futures contract, as applicable or to provide investment advice. Supporting documentation for any claims, comparisons, statistics or other technical data in this website is available by contacting Cboe Global Markets.
Trading FLEX options may not be suitable for all options-qualified investors; the strategies discussed in this report should only be considered by investors with extensive prior options trading experience.