


Data Analytics and Indices
Cboe MSCI Benchmark Indexes Delivered Less Volatility and Strong Risk-Adjusted Returns
Over the years, investors have found utility in Cboe’s benchmark indexes that reflect the writing of options based on U.S. stock indexes. These indexes, such as the BXM, PUT and BXRD indexes, can help market participants enhance the cash flow and lower the volatility typically associated with equity investing. For investors looking to replicate the same analysis on global stocks, Cboe introduced BuyWrite and PutWrite indexes based on the MSCI EAFE and Emerging Markets indexes on June 24.
The indexes write cash-settled, large-sized, options on either the MSCI Emerging Markets Index (MXEF) or the MSCI EAFE® Index (MXEA), which have approximate market capitalizations of $4 trillion and $13 trillion, respectively. Further, the MXEF Index is scheduled to increase its small allocations to China A-Shares in August and November of 2019.
Index Performance
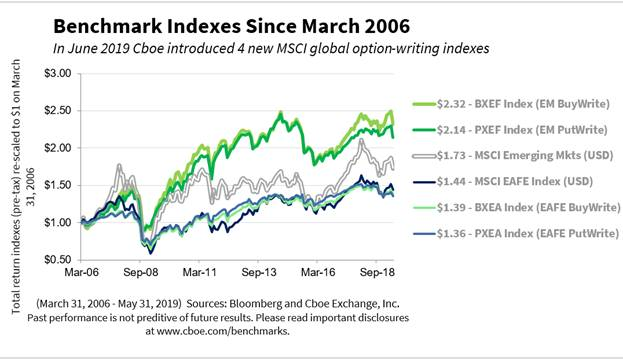
Historical price data for the new indexes dates back to March 31, 2006. A breakdown of how the benchmark indexes performed in different categories from March 31, 2006, through May 31, 2019 is below:
Strategies that engage in covered call writing or cash-secured put writing collect options premiums that can act as a cushion in the event of downturns in the stock market. All four new benchmark indexes collect options premiums each month, which helped provide a cushion during the 2008 financial crisis. As shown in the metrics table below, all four options indexes had less severe drawdowns than the stock indexes – the options premiums collected helped cushion the fall. Many investors who are concerned about possible future drops in stock prices are turning to option-writing strategies to help serve as a cushion in the event of a new bear market. For relative performance of SPX options benchmarks in up-regimes and down-regimes, see the table at page 17 in this whitepaper from Wilshire Analytics.
The BXEF and PXEF indexes had the largest gains among the six indexes in the Monthly Gross Premiums chart below.

Higher Returns and Lower Volatility
Cboe’s BXEF and PXEF indexes had higher returns and lower volatility than the MSCI EAFE and EM indexes, and so it’s not surprising that the BXEF and PXEF indexes had higher Sharpe and Sortino Ratios than the MSCI EAFE and EM indexes. As a caveat, note that the Sharpe Ratio assumes a normal distribution, but all six indexes in the above chart have non-normal distributions and negative skewness.
Metrics
As shown in the table below, all four Cboe benchmark indexes had lower standard deviations, lower maximum drawdowns and lower betas than the MSCI EAFE and EM stock indexes. As a general principle, over the long term, one would expect strategies that engage in covered call writing or cash-secured put writing (and collect the options premium) would have lower standard deviations, lower maximum drawdowns and lower betas more often than related stock indexes. These results contradict the myth that all options strategies are extremely volatile and risky – no surprise to options experts.


The chart above shows the gross amount of the premium received (as a percentage of the underlying index values) every month since April 2008 for two new put-writing indexes. Premiums collected for the PXEF Index were usually higher than those collected for the PXEA Index because the implied volatility was usually higher for the MSCI EM Index than the MSCI EAFE Index. While the gross option premium received is a positive number, option-writing strategies can have drawdowns. However, the option premiums received can act as a cushion to partially mitigate the impact of large stock drawdowns.
The four new Cboe MSCI options-based benchmark indexes can serve as valuable tools to help investors manage global portfolios and volatility, and to generate monthly income.
Visit the websites below to learn more about how index options can be used in portfolio management.
There are Cboe Risk Management Conferences around the world to give investors the information they need to know now. Global indexes and portfolio management will be discussed at the next Cboe RMC in Munich on September 9 – 11, 2019.

