


Global Markets
Tradable Products
Featured Products

Guest Author: Scott Phillips, Lavaca Capital
Despite increased realized volatility in the equity market during the first five months of 2022, the response of the VIX Index was truly anomalous. Lavaca Capital’s Scott Phillips breaks it down in this guest blog.
The Cboe Volatility Index (VIX Index) is a calculation designed to estimate the 30-day expected volatility of the U.S. stock market by aggregating the weighted prices of S&P 500 Index call and put options over a wide range of strike prices. Options traded on the S&P 500 Index that have maturities between 23 and 37 days are used to calculate the price of the VIX Index. While this measurement gives us a look into the market’s expectations of future volatility, it does not paint a complete picture.
There are currently 9,547 listed put and call option contracts on the S&P 500 Index, ranging in maturity from one day to five years, with the last listed maturity on December 17, 2027. Each of these options contains its own implied volatility which drives the option’s price. In general, the higher the implied volatility of an option, the higher the option’s price. For example, the VIX Index measured at 28.71 on June 30, 2022, which implies a daily move in the S&P 500 Index of approximately 1.8%. This is calculated by dividing the current VIX Index level by 16, meaning a VIX Index level of 16 would equate to a market expected daily move of +/- 1%.
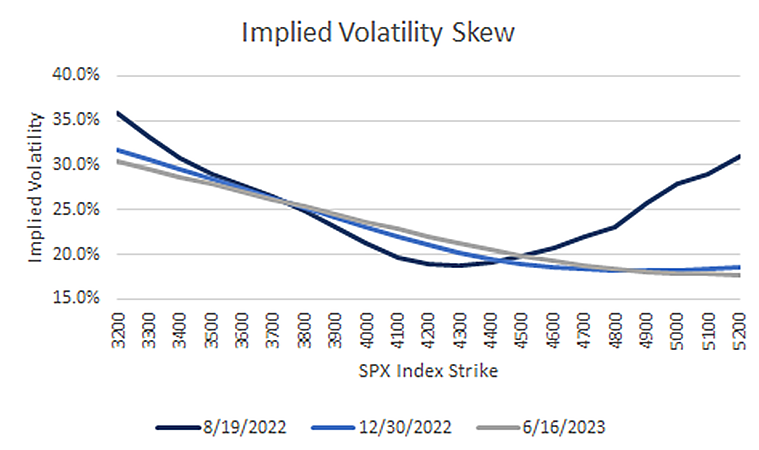
The chart below plots the volatility of individual options on three different expiration dates: August 19, 2022, December 30, 2022 and June 16, 2023.
Source: Bloomberg*
As illustrated above, the implied volatility level for each option varies significantly, depending on the option strike price. Notice that implied volatilities rise more significantly as the strike price moves down. This is a phenomenon called skew that originated after the Black Monday Crash of 1987. The skew implies that options with strike prices below the current market are more expensive than those with strike prices above. This makes sense as the left-tail occurs seemingly more spontaneously and fiercely than the right tail. That’s why it costs more to insure your portfolio from a melt-down than a climb. The level and relationship of these various implied volatilities change daily due to market participants’ expectations of future price returns and supply and demand forces. If investors are scared, they tend to reach for downside protection. When investors are more bullish, they tend to invest in options that pay off on large upside moves and focus less on downside risk.
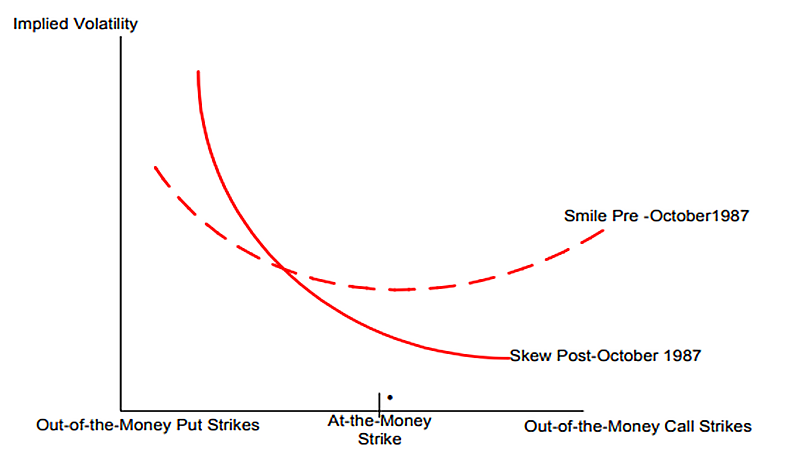
The chart below illustrates the Cboe Skew Index pre and post the 1987 Black Monday Crash.
Source: Cboe Global Markets*
The lack of a meaningful increase in implied volatility this year, despite a large market sell-off, is quite unusual. Historical context may be helpful to understanding the current market environment.
Since the launch of the VIX Index on January 19, 1993, the S&P 500 Index has experienced 53 six-month periods where price has declined between 20% and 25%. During this period, there were 5,534 unique six-month return periods, looking at rolling six-month returns. The average VIX Index level at the end of any of these six-month declines was 37.37, and the VIX Index increased an average of 88% during the same periods.
As of June 30, 2022, the S&P 500 Index has declined 20.5%, excluding dividends. The VIX Index closed at 28.71 on June 30, nine points, or 23%, lower than the average closing level, compared to historical declines between 20% and 25%. The VIX Index has risen only 53% this year, despite a greater than 20% decline in the S&P 500 Index. Moreover, the VIX Index’s June 30 closing level was the second lowest closing VIX Index level in the last 22 years, compared to six-month declines between 20% and 25%. There were only three similar six-month periods where the VIX Index closed at a lower level; March 15, 2001, and June 28 and 29, 2022, which marked the lowest VIX Index close ever for a decline of this nature. Six months following the March 15, 2001 close, on September 20, 2001, the VIX Index reached a high of 43.74 as the S&P 500 Index declined another 16% between March and September 2001.

A similar story emerges when analyzing long-term volatility, as characterized by the one-year VIX Index. On average, prior to 2022, the one-year VIX Index rose 73% during similar drawdown periods in the S&P 500 Index. On June 30, 2022, the one-year VIX Index had risen only 13%. The average close for the one-year VIX Index for this draw-down scenario is 39.43; however, the index closed at 31.1 on June 30, marking the second lowest close ever for a drawdown greater than 20%. The lowest close was two days earlier on June 28.

Looking back at the first half of 2022 and considering the magnitude of the draw-down in the S&P 500 Index, the volatility environment has been profoundly abnormal. Since the launch of the VIX Index, the past six-month period has been the weakest for volatility in 29 years, relative to similar S&P 500 Index price moves.
Because of the lack of an implied volatility increase in 2022 relative to what has occurred in similar historical market drawdowns, those using put options to hedge a downside move in the S&P 500 likely did not get the response they were looking for from their option hedges.
This article is part of Cboe’s Guest Author Series, where firms and individuals share their insights, strategies and ideas with the broader Cboe community. Interested in contributing? Email [email protected] or contact your Cboe representative to learn more.
The authors prepared this article at the request of Cboe. The information in this article is for informational purposes only and no statement within this article should be construed as investment advice or a recommendation to buy or sell any security. There are important risks associated with transacting in any of the Cboe Company products discussed here. Before engaging in any transactions in those products, it is important for market participants to carefully review the disclosures and disclaimers contained at https://www.cboe.com/options_futures_disclaimers.
Disclosures
* Policies for valuing and calculating implied volatility or other calculations in this material are available upon request.
This material is provided by Lavaca Capital for informational and educational purposes only. In no way should any content contained herein be construed to represent trading or investment advice. None of the information contained herein constitutes a recommendation by Lavaca Capital that any particular security, portfolio, transaction, or investment strategy is suitable for any specific person. Lavaca Capital does not advise you personally concerning the nature, potential, value or suitability of any particular security portfolio, transaction, investment strategy or other matter. As such, all viewers agree that under no circumstances will Lavaca Capital, its partners, officers, employees, affiliates, and agents be held liable for any loss or damage caused by your reliance on information obtained from this content, including any articles, videos or other materials. Options trading involves risk and is not suitable for all investors.
All opinions expressed by any person in this content, including any articles, videos or other materials, are solely the opinions of the author/speaker. Do not consider any opinion expressed by the author/speaker as a specific inducement to make a particular investment or follow a particular strategy, but only as an expression of individual opinion. The author/speaker and Lavaca Capital are not under any obligation to update or correct any information provided in this content. All statements and opinions are subject to change without notice.
Please keep in mind that options are a specialized form of investment and are not suitable for all persons or for use in all portfolios. If you buy an option, you could lose all of your investment and if you sell one, you could expose yourself to nearly unlimited risk of loss. Still, if you understand the risks and benefits of options you may find them to be a useful part of your investment strategy. Remember more advanced strategies (such as spreads, collars and volatility trades) will likely require you to conduct additional research to determine whether their complexity and risk is right for you. This presentation is for educational purposes only and is designed to help you make intelligent and informed choices regarding options. Before acting on information in this content, you should consider whether it is suitable for your particular circumstances and strongly consider seeking advice from your own financial, investment and/or tax advisor. For additional information on options or investments, please consult with your investment advisor or broker and review the brochure entitled Characteristics and Risks of Standardized Options.
This presentation includes forward-looking statements. All statements that are not historical facts are forward-looking statements, including any statements that relate to target or expected returns, future market conditions, results, operations, strategies or other future conditions or developments and any statements regarding objectives, opportunities, positioning or prospects. Forward-looking statements are necessarily based upon speculation, expectations, estimates and assumptions that are inherently unreliable and subject to significant business, economic and competitive uncertainties and contingencies. Forward-looking statements are not a promise or guaranty about future events.
Indexes are unmanaged and have no fees or expenses. An investment cannot be made directly in an index. The Funds consist of securities which may vary significantly from those in the S&P 500 Index and performance calculation methods may not be entirely comparably. Accordingly, comparing results shown to those of the Indexes named herein may be of limited use.

