


Data Analytics and Indices
What is the Cboe Volatility Index (VIX Index)?
It is simply a number derived from a calculation. What it measures is a bit more complicated. It provides a reading of constant, 30-day expected volatility of the S&P 500 Index (S&P 500). This measure is derived from real-time, mid-quote prices of a strip of S&P 500 options (SPX), whose expiries land between 23 and 37 days from the current trading day.
The VIX Index’s output reading is a non-directional, annualized expectation for the standard deviation of the S&P 500. (Quick back of the envelope mathematical reference point: the VIX Index at 16 means an expected +/- 16% annual move for the S&P 500, which would equal a daily range of +/- ~1%.)
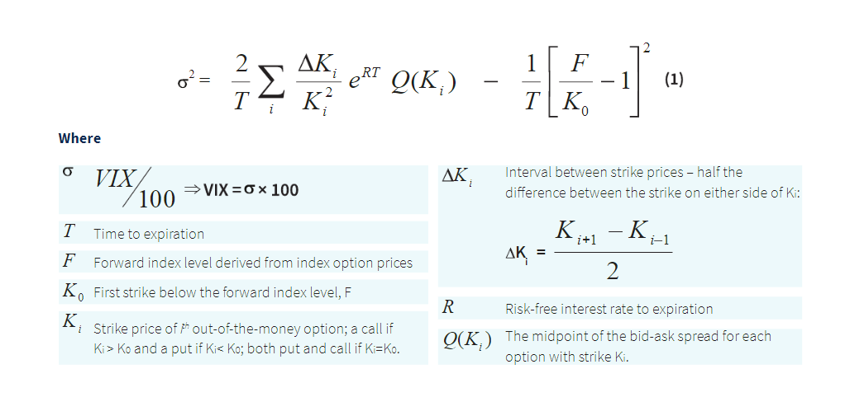
For those willing to go deep into the weeds, this is the actual formula (and you can access frequently asked questions about the VIX Index here.)
The 30-day time horizon is of the utmost importance for understanding the VIX Index’s significance. Since the calculation used a range of SPX options series expiring between 23 and 37 days, it is not designed to provide insight into expectations for volatility in periods preceding or following the range pegged around the 30-day mark. To cover other time frames, we previously released volatility indices with 9-day (VIX9D), 3-month (VIX3M), 6-month (VIX6M) and 1-year (VIX1Y) time frames using the same methodology as the VIX Index.
Given the volume in shorter term options trading, specifically options with one or zero days to expiration, and the related focus on short term/intraday volatility in markets, we had the “ingredients” to develop the Cboe 1-Day Volatility Index (VIX1D Index).
Important Qualities of the VIX1D Index
This new index uses two tenors of SPX options (those with zero and one day to expiration). To account for the inclusion of same-day expiring options – which ‘disappear’ at the end of the day – the VIX1D Index deploys a time-weighted methodology of those two SPX options strips to get its measure.
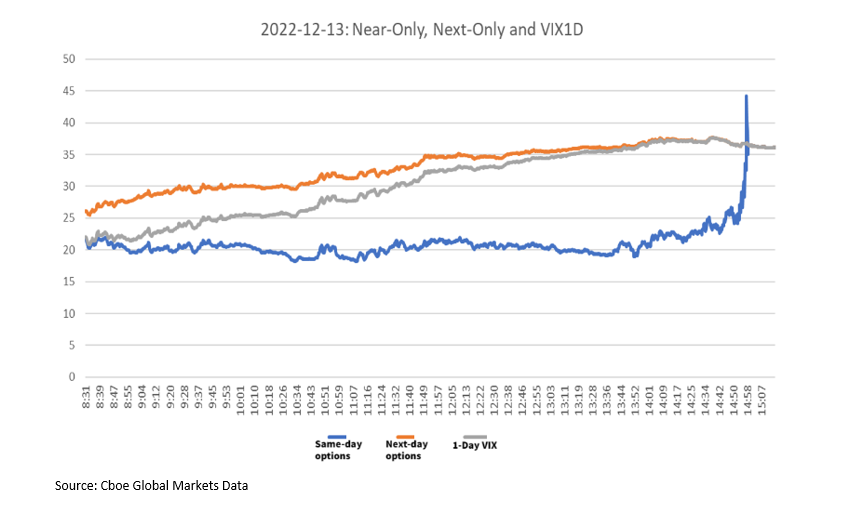
At the beginning of a trading day, the VIX1D Index calculation is nearly fully weighted to the current day’s expiring SPX options strip, and as the 405-minute trading day progresses, the weighting gradually shifts to the SPX options expiring on the next day. The calculation of the VIX1D Index uses business years and business minutes – this is a different increment than the VIX Index, which uses calendar years and calendar minutes.
Per the white paper, when the time to expiration for the near-term (current day expiry) series is less than 60 business minutes (approximately 3:00 p.m. ET), the single-term volatility of the near term will be the last valid value and persisted until the near-term expiration time. During this period, the VIX1D Index will be the interpolation between the persisted near-term volatility and the next-term volatility, where the weights are heavily concentrated on the next-term. At the near-term expiration time, the VIX1D Index will fully converge to the volatility of the next term.
After the near-term contracts expire, at approximately 4:00 p.m. ET, the near-term leg (current day expiry) will no longer exist and the VIX1D Index will be calculated from 4:00 p.m. ET to 4:15 p.m. ET using only a single expiration – the next-term expiry. Note: the VIX1D Index is calculated during regular trading hours only.
To visualize this time-weighting in action and how it impacts VIX1D, see the chart below. The full methodology for the VIX1D Index can be accessed here.
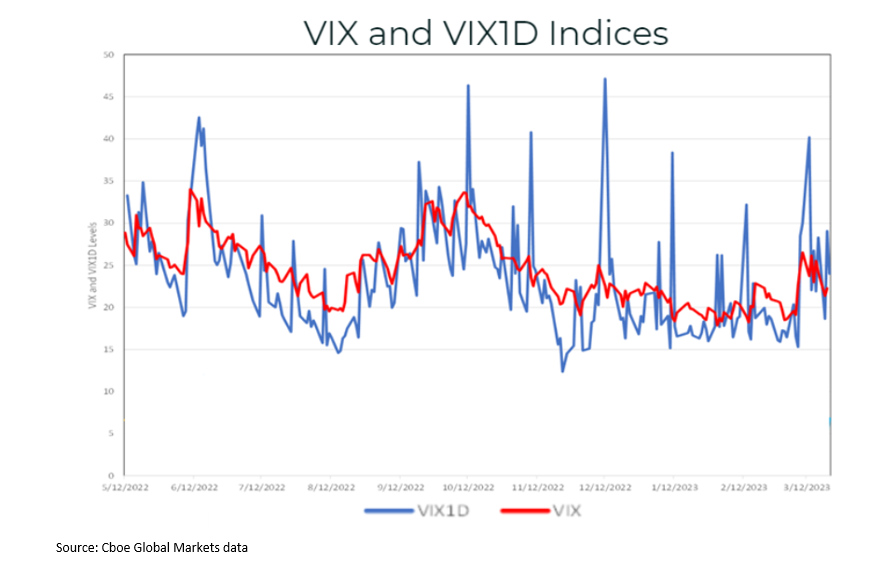
By its nature, on days of heightened volatility, the VIX1D Index is expected to reflect short-term impacts, whereas by its design, the VIX Index is expected to continue to reflect expected volatility 30 days out. For example, amid the recent collapse of two U.S. banks between March 8, 2023, and March 13, 2023, the VIX Index rose from 19.11 to 26.52 (38.8%) while the backtested VIX1D Index rose from 15.30 to 40.19 (162.7%) over this period.
This trait is observable in the chart below comparing the VIX and VIX1D Indices.
The VIX Index Observations (and Misconceptions)
Over the course of its 30-year history (the VIX Index’s birthday was this month!), a few general observations have surfaced. Market participants must realize that these observations are not set in stone and that exceptions exist. And there are also some myths that need debunking.
1 - The VIX Index tends to be inversely correlated to the S&P 500. When the S&P 500 is down, there is usually more hedging demand, which tends to increase the prices of SPX put options used in the VIX Index calculation.
Yet there are instances where market participants may view themselves as adequately hedged during a drawdown, in which case the VIX Index can fall alongside the market since there isn’t the same demand for protection via SPX options. The inverse scenario also happens from time to time (market up, the VIX Index up). These correlated moves happen ~20% of the time.
This is attributable to a supply and demand dynamic manifesting in equity derivatives. (Speaking of correlations, the VIX1D Index has moderately high correlations to the VIX Index but adds information embedded in the extremely short-dated SPX options.)
2 - The VIX Index is often portrayed as a gauge of overall market sentiment, but that is not the case. It is a measurement of expected volatility based around a 30-day time horizon and the S&P 500. The VIX Index does not, nor is it intended to, offer insight into tomorrow’s market movement, nor the movement of other asset classes. (Though we’ll note that the VIX Index methodology has been applied to different asset classes to produce measurements of expectations for 30-day volatility.) By the same token, the VIX1D Index would not be the most appropriate tool, for example, for attempting to gauge next week’s potential variance of returns.
3 - The VIX Index tends to be mean reverting over time. Unlike equities, the VIX Index cannot move higher forever, and it cannot go to zero. What assumptions one makes about the phrase ’over time’ is what can make this a difficult observation to capitalize on. (If the VIX Index level was 70 at some point it will return to its historical average range, but will that be in one month? Six months? A year?)
4 – The recent volume trends in short-term trading of SPX options on their day of expiration have not altered bid/asks spreads in SPX options with longer-dated tenors that are used to calculate the VIX Index. Moreover, SPX options with shorter-dated tenors that are used to calculate the VIX1D Index have comparable bid/ask spreads as those used in the VIX Index calculation.
5 - The VIX Index itself is not a tradable instrument. The VIX Index was first calculated and disseminated beginning in 1993; however, tradable volatility products were not listed for exchange trading until 2004 when VIX futures debuted, followed by VIX options in 2006. The final settlement value for those VIX derivatives is determined through a special opening quotation (SOQ) of the VIX Index (which uses traded prices vs. non-actionable mid-quote prices) on their expiration days. We currently have no plans to develop derivatives based on the VIX1D Index.
What Volatility Indices May (and May Not) Tell Us
The VIX Index attempts to provide market watchers, traders and investors a real-time look at market sentiment regarding the variance of potential returns in a month. The VIX1D Index is intended provide a real-time look at market sentiment over the current trading day (today). In 2022, the VIX Index averaged ~23, while the market realized ~24. This 1% difference – the risk premium – is lower than historical averages of 3-4%, but not unfathomable, or even unreasonable.
Market, and thus volatility, regimes change over time. The markets of 2018 are not the markets of 2023. To expect the VIX Index to act as it did 3, 5 or 10 years ago is to extrapolate the past into the future – and many of us are familiar with the phrase, “past performance is not indicative of future results.”
For more information on the VIX1D Index, see our press release or visit www.cboe.com/indices.

