


Derivatives Market Research
The ratio of listed option put volume to call volume is a well-known measure for traders who appreciate a relatively simple metric comprised of accessible data that can be applied across assets and time frames.
Like most indicators, interpretation of the put/call ratio involves several assumptions – primarily that puts express a bearish view, while calls are bullish. Like the Cboe Volatility ® (VIX®) Index, a high put/call ratio is often considered a sign of investor uncertainty, while a low level usually indicates optimism. Historical data generally supports this assumption, as the put/call ratio typically spikes during crashes and reverts to lower levels in bull markets.
In practice, many traders prefer to examine put/call ratios for index, ETF and equity products separately based on the characteristics and use cases across products. For convenience, Cboe Global Markets® provides daily summary data for several market statistics, including a put/call calculation that isolates equity (single stock) options flow trading on the hybrid Cboe Options Exchange (C1).
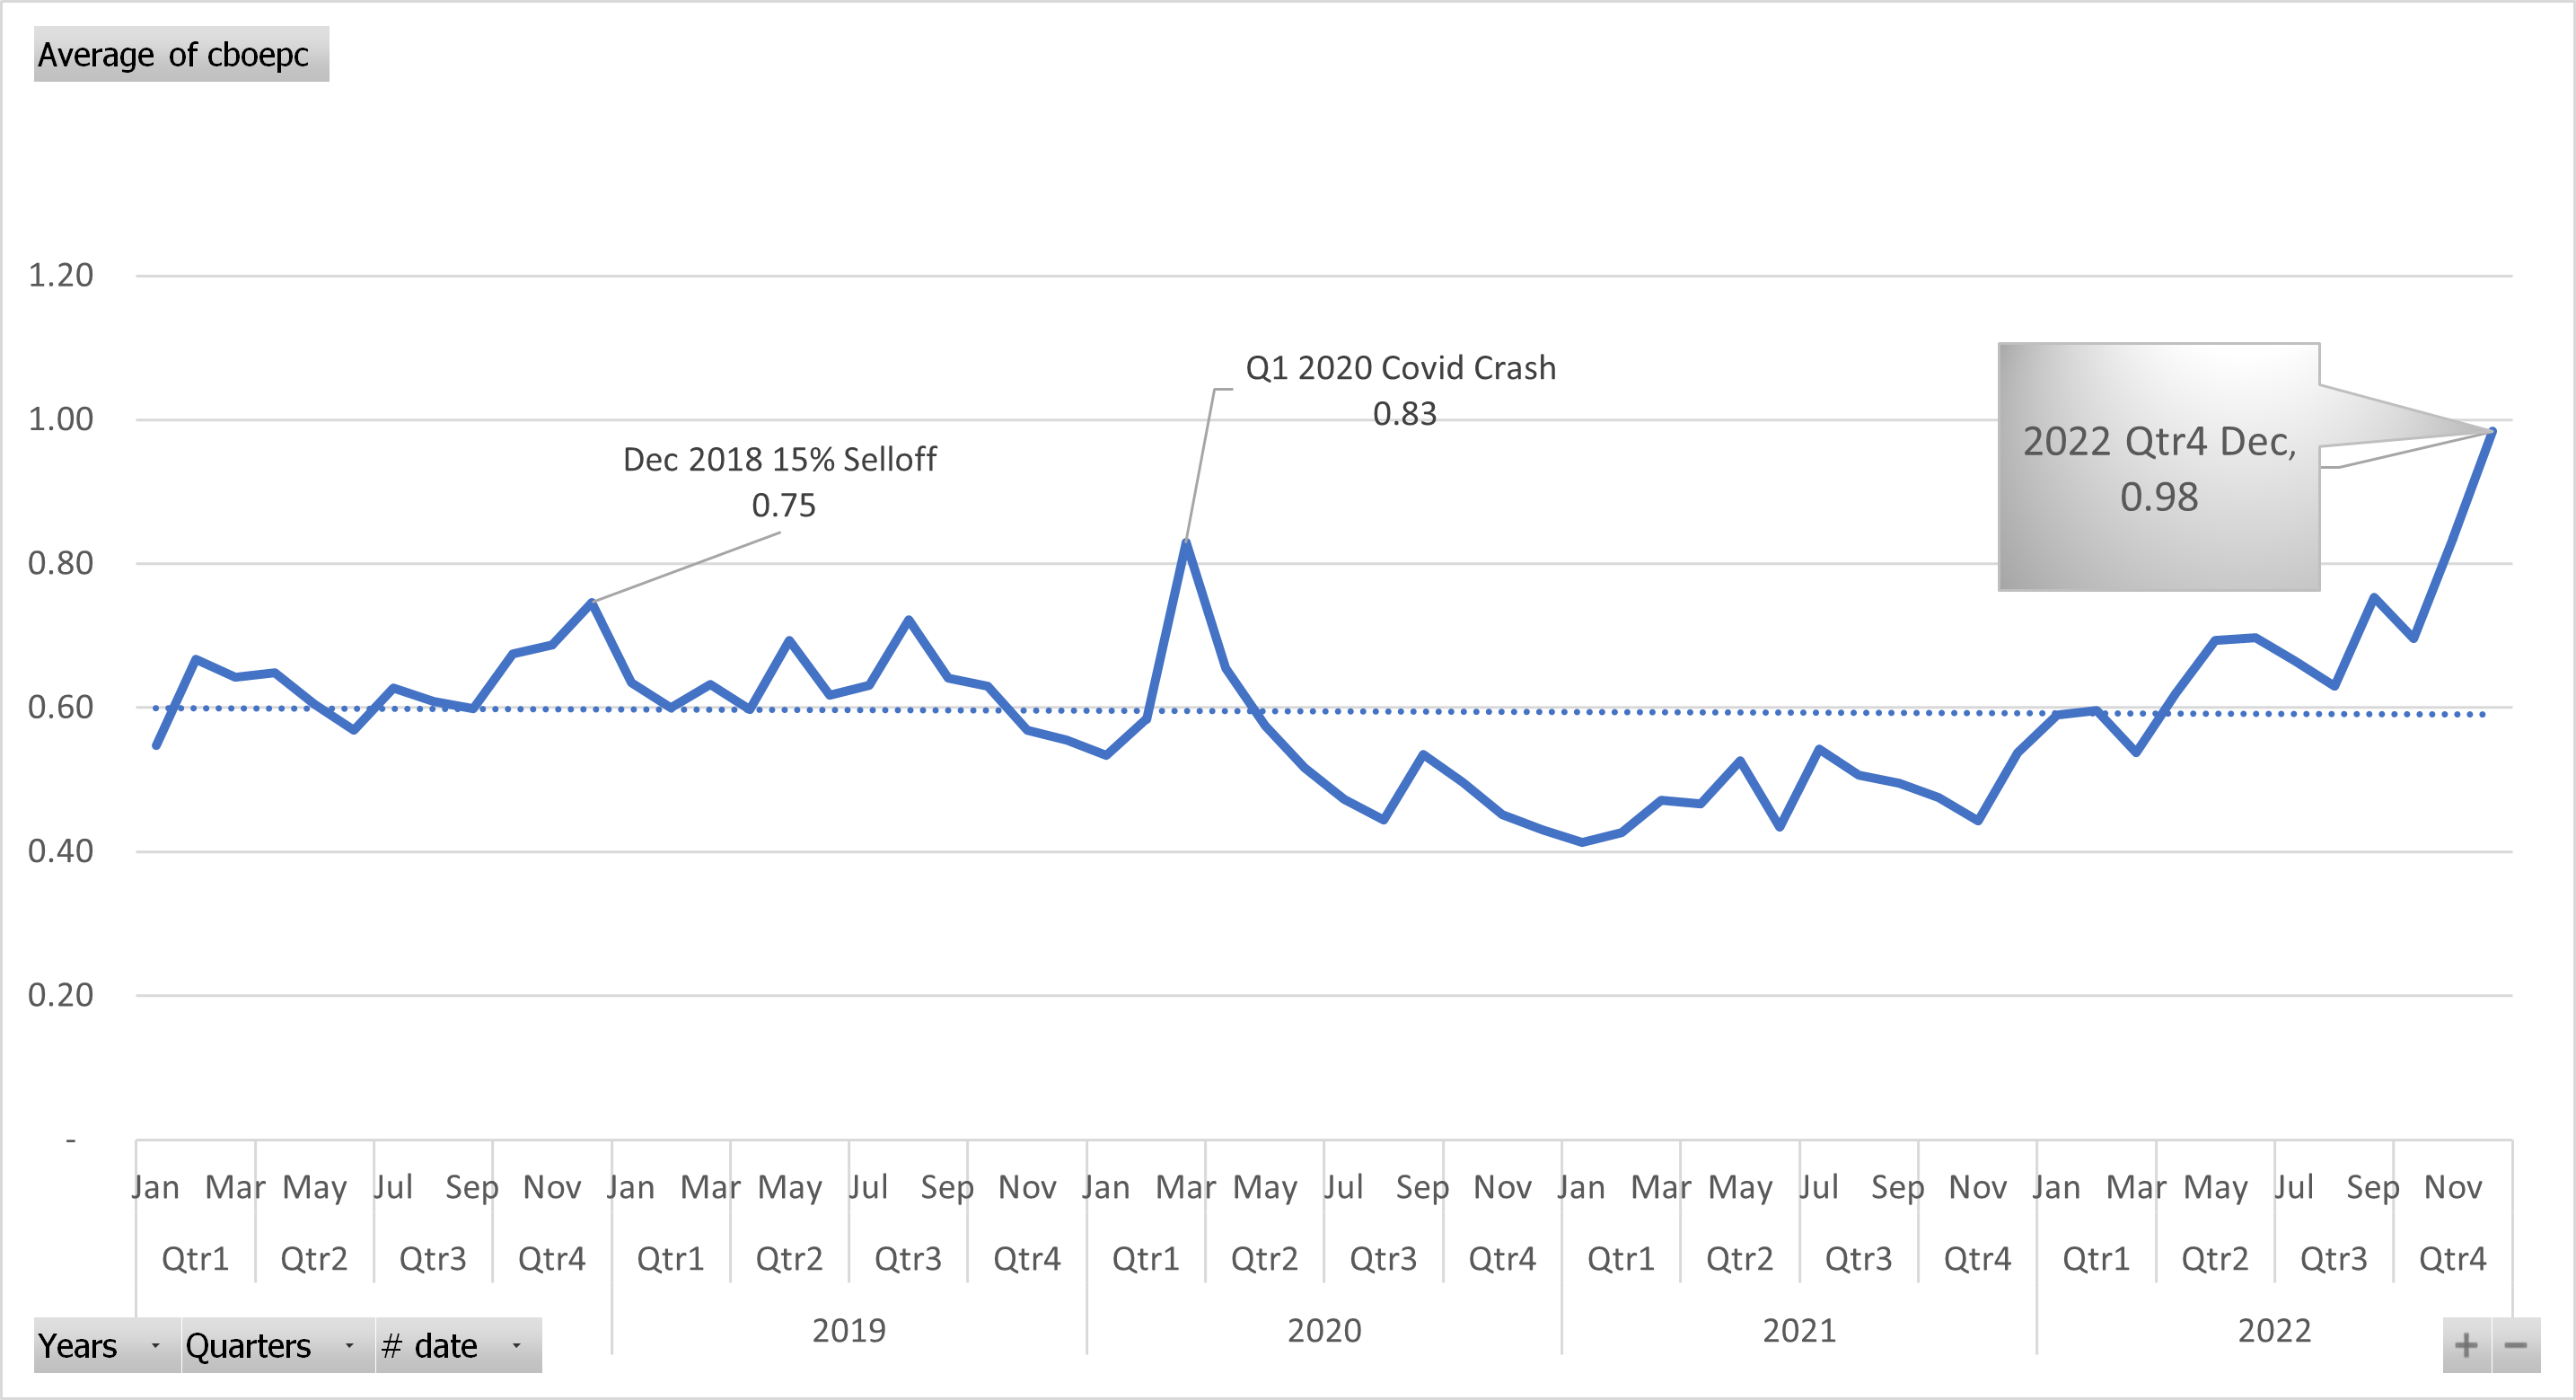
Source: Cboe Daily Market Statistics
As shown in the chart above, the daily average put/call ratio over the past five years has ranged from about 0.4 to 0.8, with a trendline near to 0.6, or three puts trading for every five calls. Prior to 2022, the highest p/call ratios correspond to significant market shocks, while the lowest levels were seen during the 2020-21 bull market, when the S&P 500® Index nearly doubled from 2300 to 4600 in 21 months.
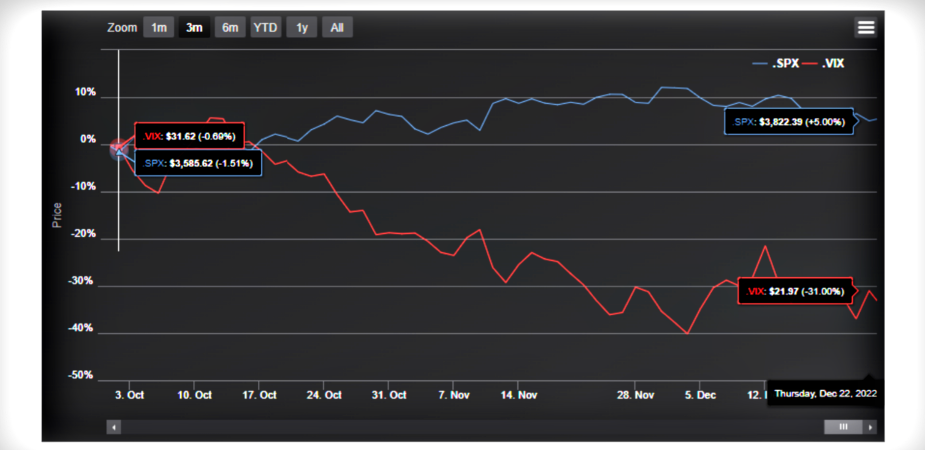
Confounding some analysts and financial media, including columnists at Forbes, MarketWatch and Interactive Brokers, is the recent rise of the average daily put/call ratio on C1 to nearly 1.0 in the current quarter despite a rebound for equities and lower levels of volatility, illustrated by a climb of nearly 5% for the S&P 500 and a decline of nearly 10 points for the VIX® Index.
Source: WhatsTrading (trade-alert.com)
The inclusion of equity option data from all exchanges paints a similar picture, with the put/call ratio spiking to 0.85 in Q1 2020, followed by nearly 18 months at very low levels near 0.4 and a sharp climb higher this year to the current level peak near 0.84.
Source: Cboe DataShop Option Sentiment
A closer look at recent daily data shows interesting spacing of the highest put/call ratios with Wednesdays consistently seeing the highest levels.
Intraday data for one of the highest spikes on December 7 shows large surges of put volume hitting the market at 1 p.m. ET, and again near 2:30 p.m., causing the ratio to jump sharply from 0.86 to nearly 1.3 on the day.
Examination of trade-level data on this day shows several large deep-in-the-money (ITM) put trades in AMZN with total volume exceeding open interest by a wide margin, eliminating the possibility of closing activity.
Source: Cboe Trade Alert
The most active contract, the 1/23 125 AMZN put, saw nearly 99k contracts trade, compared to 9,275 contracts open at the time. Open interest the next day was little changed.
Source: Cboe Trade Alert
A look at most-active ITM put flow on that date shows similar deep in the money activity in C, TSLA and BABA, with little next day open interest change.
Source: Cboe Trade Alert
Breaking the data down by moneyness identifies a trend that accelerated in the second half of 2022—a surge in ITM put activity (black line near the bottom)—making up nearly 11% of the ADV in Q4 compared to a multi-year average near 5%. In fact, Q4 2022 ITM put share is higher than both ATM put and call share.
Source: Datashop Option Sentiment
The incidence of heavy volume in deep ITM contracts with no resulting open interest is indicative of a strategy employed by the largest market participants to minimize exposure to early assignment. Commonly seen in deep ITM calls ahead of an ex-dividend date, this type of activity creates large blocks of open interest that are immediately assigned by another party. The net effect is that early assignment on original short positions is avoided based on the percentage pro-rata allocation method used by OCC. Another effect is a sharp spike in the equity put/call ratio that is nondirectional and unrelated to typical option use cases.
Historically, dividend related ITM call exercises have resulted in some of the highest call volume days of the year, including March 15, 2012, when a record 9M calls traded in SPY, but changes to the clearing process since then have dampened that activity.
Mathematically, the decision to exercise a call or put early is related to the extrinsic value of the contract. For calls, if the dividend(s) amount exceeds the extrinsic value, a long holder is usually better off exercising. For puts, the decision is a bit more subtle, with extrinsic value compared to the carry cost on the strike. As U.S. interest rates have increased sharply to decade-highs this year, the cost of carry for deep positions has increased, while the selloff in many popular stocks has resulted in large blocks of deep put open interest. Unlike dividend-related call exercises, which tend to happen quarterly, put exercise dynamics may repeat daily if positions are open. In practice, put exercises are more common on Wednesdays based on the timing of settlement. Puts exercised on a Wednesday result in a stock sale on Thursday, which settles Monday.
Fortunately, early-exercise candidate call and put strikes for all listed products are calculated intraday and available in a subscription product on the Cboe DataShop.
A sample from the file for December 7 shows that all the active Amazon deep put strikes were considered optimal to exercise as of 2 p.m.
Source: Early Exercise Strike by Option Class - Subscription
Understanding that simple total put/call ratio calculations are likely to be impacted by noise from exercise-related activity for some time, it makes sense to consider alternate approaches that would yield more stable output.
One method involves exclusion of in-the-money options entirely, effectively avoiding the most likely contracts that would be subject to dividend (calls) and carry (puts) early assignment: P/C using only OTM and ATM contracts.
Source: Data Shop Option Sentiment
Another method takes advantage of the account-type volume disclosed in the Cboe Open-Close datasets, available for each of Cboe’s four options exchanges C1, C2℠, EDGX ® and BZX ®. As the accounts involved in the exercise-related volume are not customers, a put/call ratio calculated from the customer totals will be unaffected and remain relatively flat over the past six months.
Source: Cboe Open-Close Volume Summary
A last alternative would be to focus on smaller executions, using the size brackets included in the Open-Close datasets. This “Small Trade P/C” avoids the distortion of the large-scale early-exercise activity and may support a better picture of small-trader sentiment across time and product.
Source: Cboe Open-Close Volume Summary
As we approach the 50th anniversary of listed options and Cboe, it’s a good time to reflect on how far our markets have come while acknowledging that some aspects of the business are remarkably unchanged. Focusing on the data side, exchanges and vendors are now processing over 170 billion messages per day1 from 16 exchanges that list nearly 1.5 million contracts on over 6,000 stocks, ETFs and indices. In 2022, volume surpassed 10.3 billion contracts, or nearly 42 million contracts daily, a new record that is more than double 2019 levels. New technologies and business models have widened customer access to listed options, while strong growth in listings and expiration cycles have resonated with retail and institutional traders who have embraced options in their quest to efficiently adjust risk and express specific views.
Despite these changes, the need for simple and effective ways to characterize market activity and investor sentiment persists. For any area of interest, a close examination of volume, volatility and options can deliver quantitative and qualitative insights to enhance understanding and complement any approach to capital and risk management.
[1] https://www.opraplan.com/
Disclaimer: There are important risks associated with transacting in any of the Cboe Company products or any digital assets discussed here. Before engaging in any transactions in those products or digital assets, it is important for market participants to carefully review the disclosures and disclaimers contained at: https://www.cboe.com/us_disclaimers/. These products and digital assets are complex and are suitable only for sophisticated market participants. These products involve the risk of loss, which can be substantial and, depending on the type of product, can exceed the amount of money deposited in establishing the position. Market participants should put at risk only funds that they can afford to lose without affecting their lifestyle. © 2022 Cboe Exchange, Inc. All Rights Reserved

