


Data Analytics and Indices
The recent launch of the Cboe 1-Day Volatility IndexSM (VIX1DSM), has generated increased interest in volatility indices. The VIX1D Index joins a suite of Cboe volatility indices, which includes the VIX9DSM Index, VIX® Index, VIX3MSM Index, VIX6MSM Index, and VIX1YSM Index. The VIX1D Index seeks to measure the expected volatility of the S&P 500® Index over the current trading day and has been designed to account for the compressed measurement of expected volatility over a single day, differing from the VIX Index.
Cboe Insights | What the VIX and VIX1D Indices Attempt to Measure and How They Differ
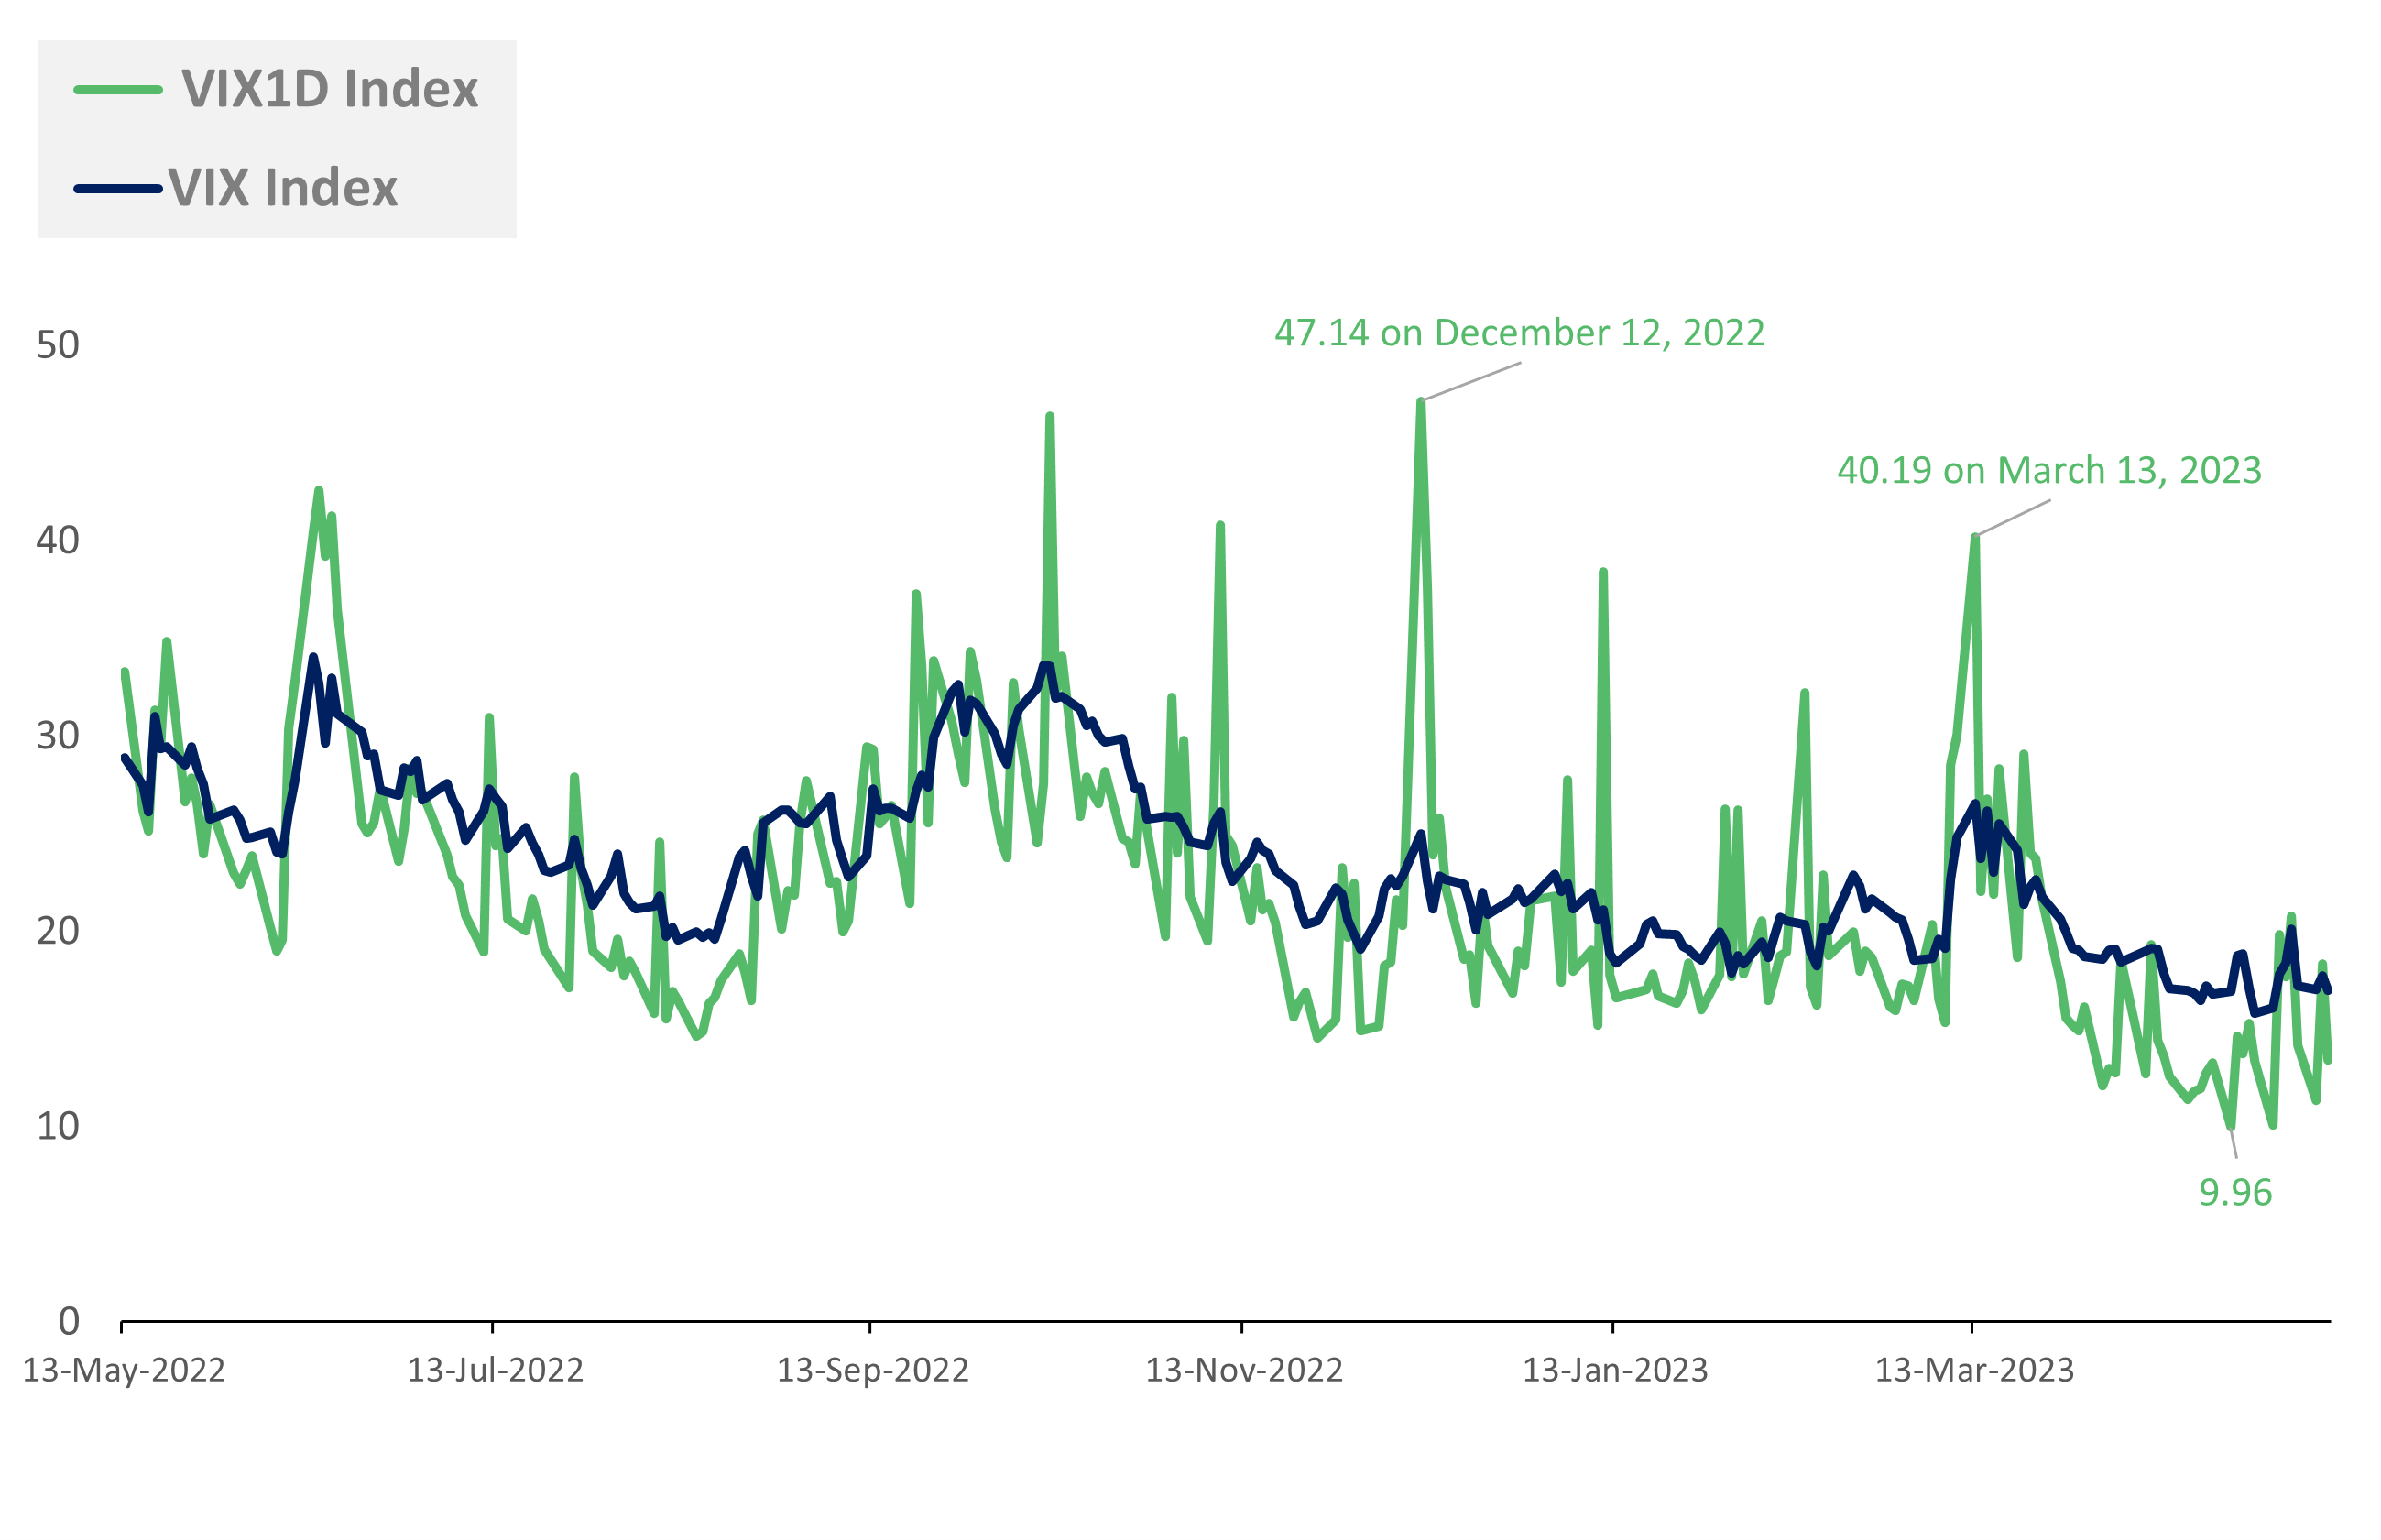
The daily historical price history of the VIX1D Index begins on May 13, 2022, when Cboe added S&P 500® (SPXWSM) options expirations for every day of the trading week. So, let’s take a look at the performance of key volatility indices, including the VIX1D Index, and the information they tell us.
Please note that these indices are gauges of expected volatility and are not tradable.
Since May 13, 2022, the daily closing value of the VIX1D Index ranged from a low of 9.96 to a high of 47.14, while the VIX Index ranged from a low of 15.78 to a high of 34.02.
Amid the recent collapse of two U.S. banks between March 8, 2023, and March 13, 2023, the VIX Index rose 38.8%, from 19.11 to 26.52, while the back-tested VIX1D Index rose 162.7%, from 15.30 to 40.19 in the same timeframe. On days of heightened volatility, the VIX1D Index is expected to reflect short-term impacts, whereas by its design, the VIX Index is expected to continue to reflect expected volatility 30 days out.
May 13, 2022-May 10, 2023
Source: Cboe Global Markets
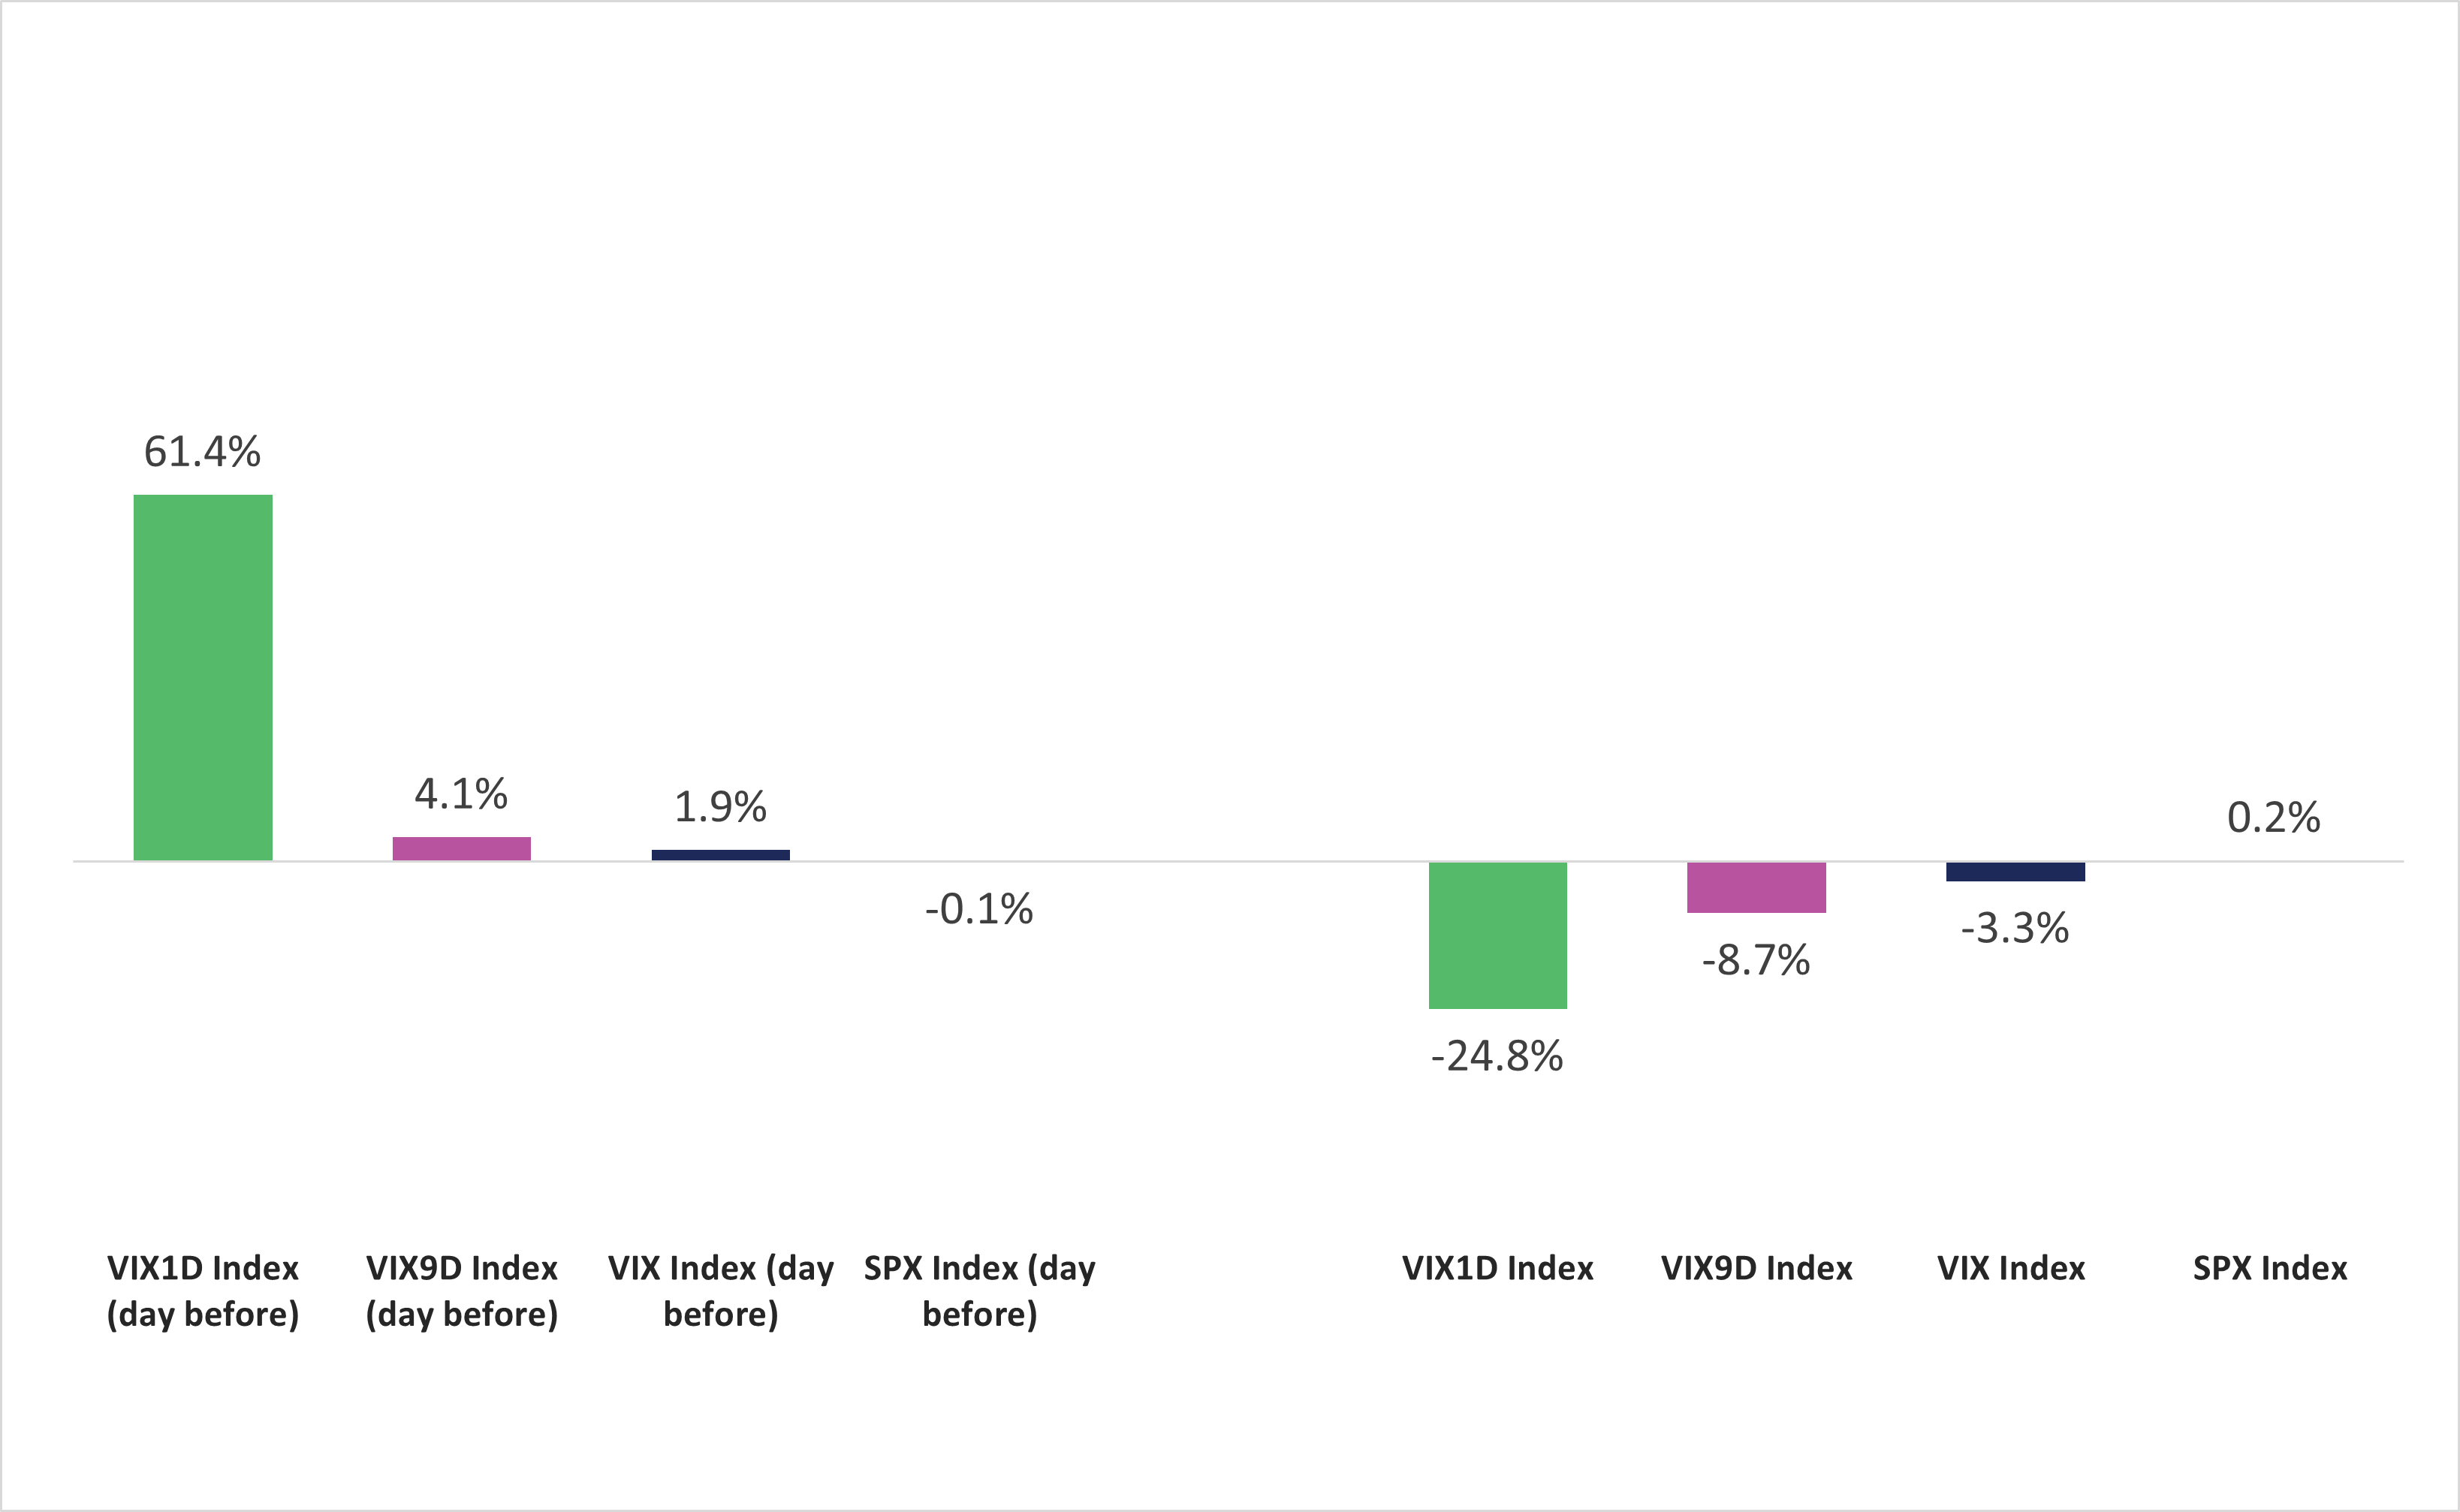
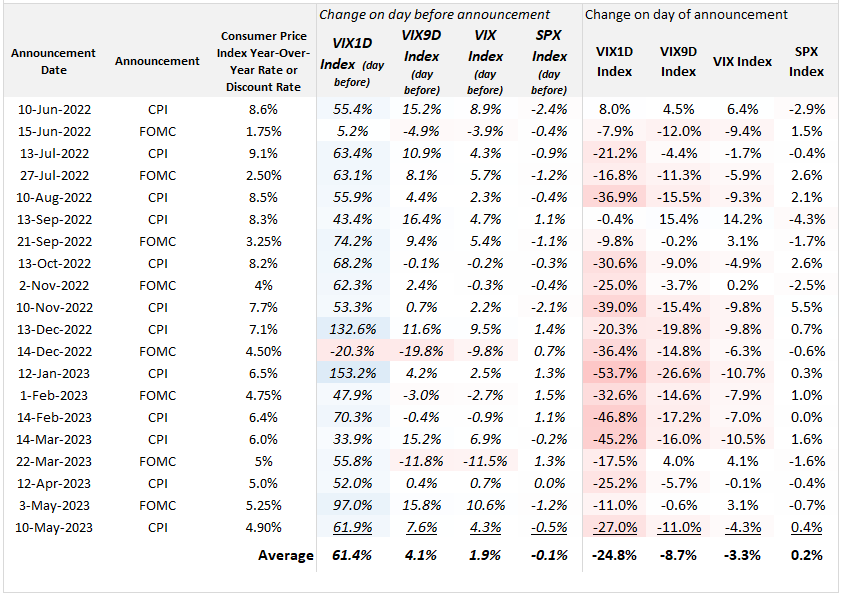
The VIX1D Index has the potential to provide useful information to investors tracing near-term event risk, investor sentiment and SPXW options prices. The two charts below show the average daily percent change for five indices on the day before and the day of 20 major U.S. announcements about changes to the Consumer Price Index (CPI), or the interest rate announcements to come out of the Federal Open Market Committee (FOMC). On the day before an announcement, the VIX1D Index was up an average of 61.4%, while the VIX Index was up an average of 1.9%. On the day of the announcement, the VIX1D Index was down 24.8% for the and the VIX Index was down 3.3%.
June 10, 2022-May 10, 2023
Source: Cboe Global Markets
*Volatility indices are not investable
Source: Cboe Global Markets
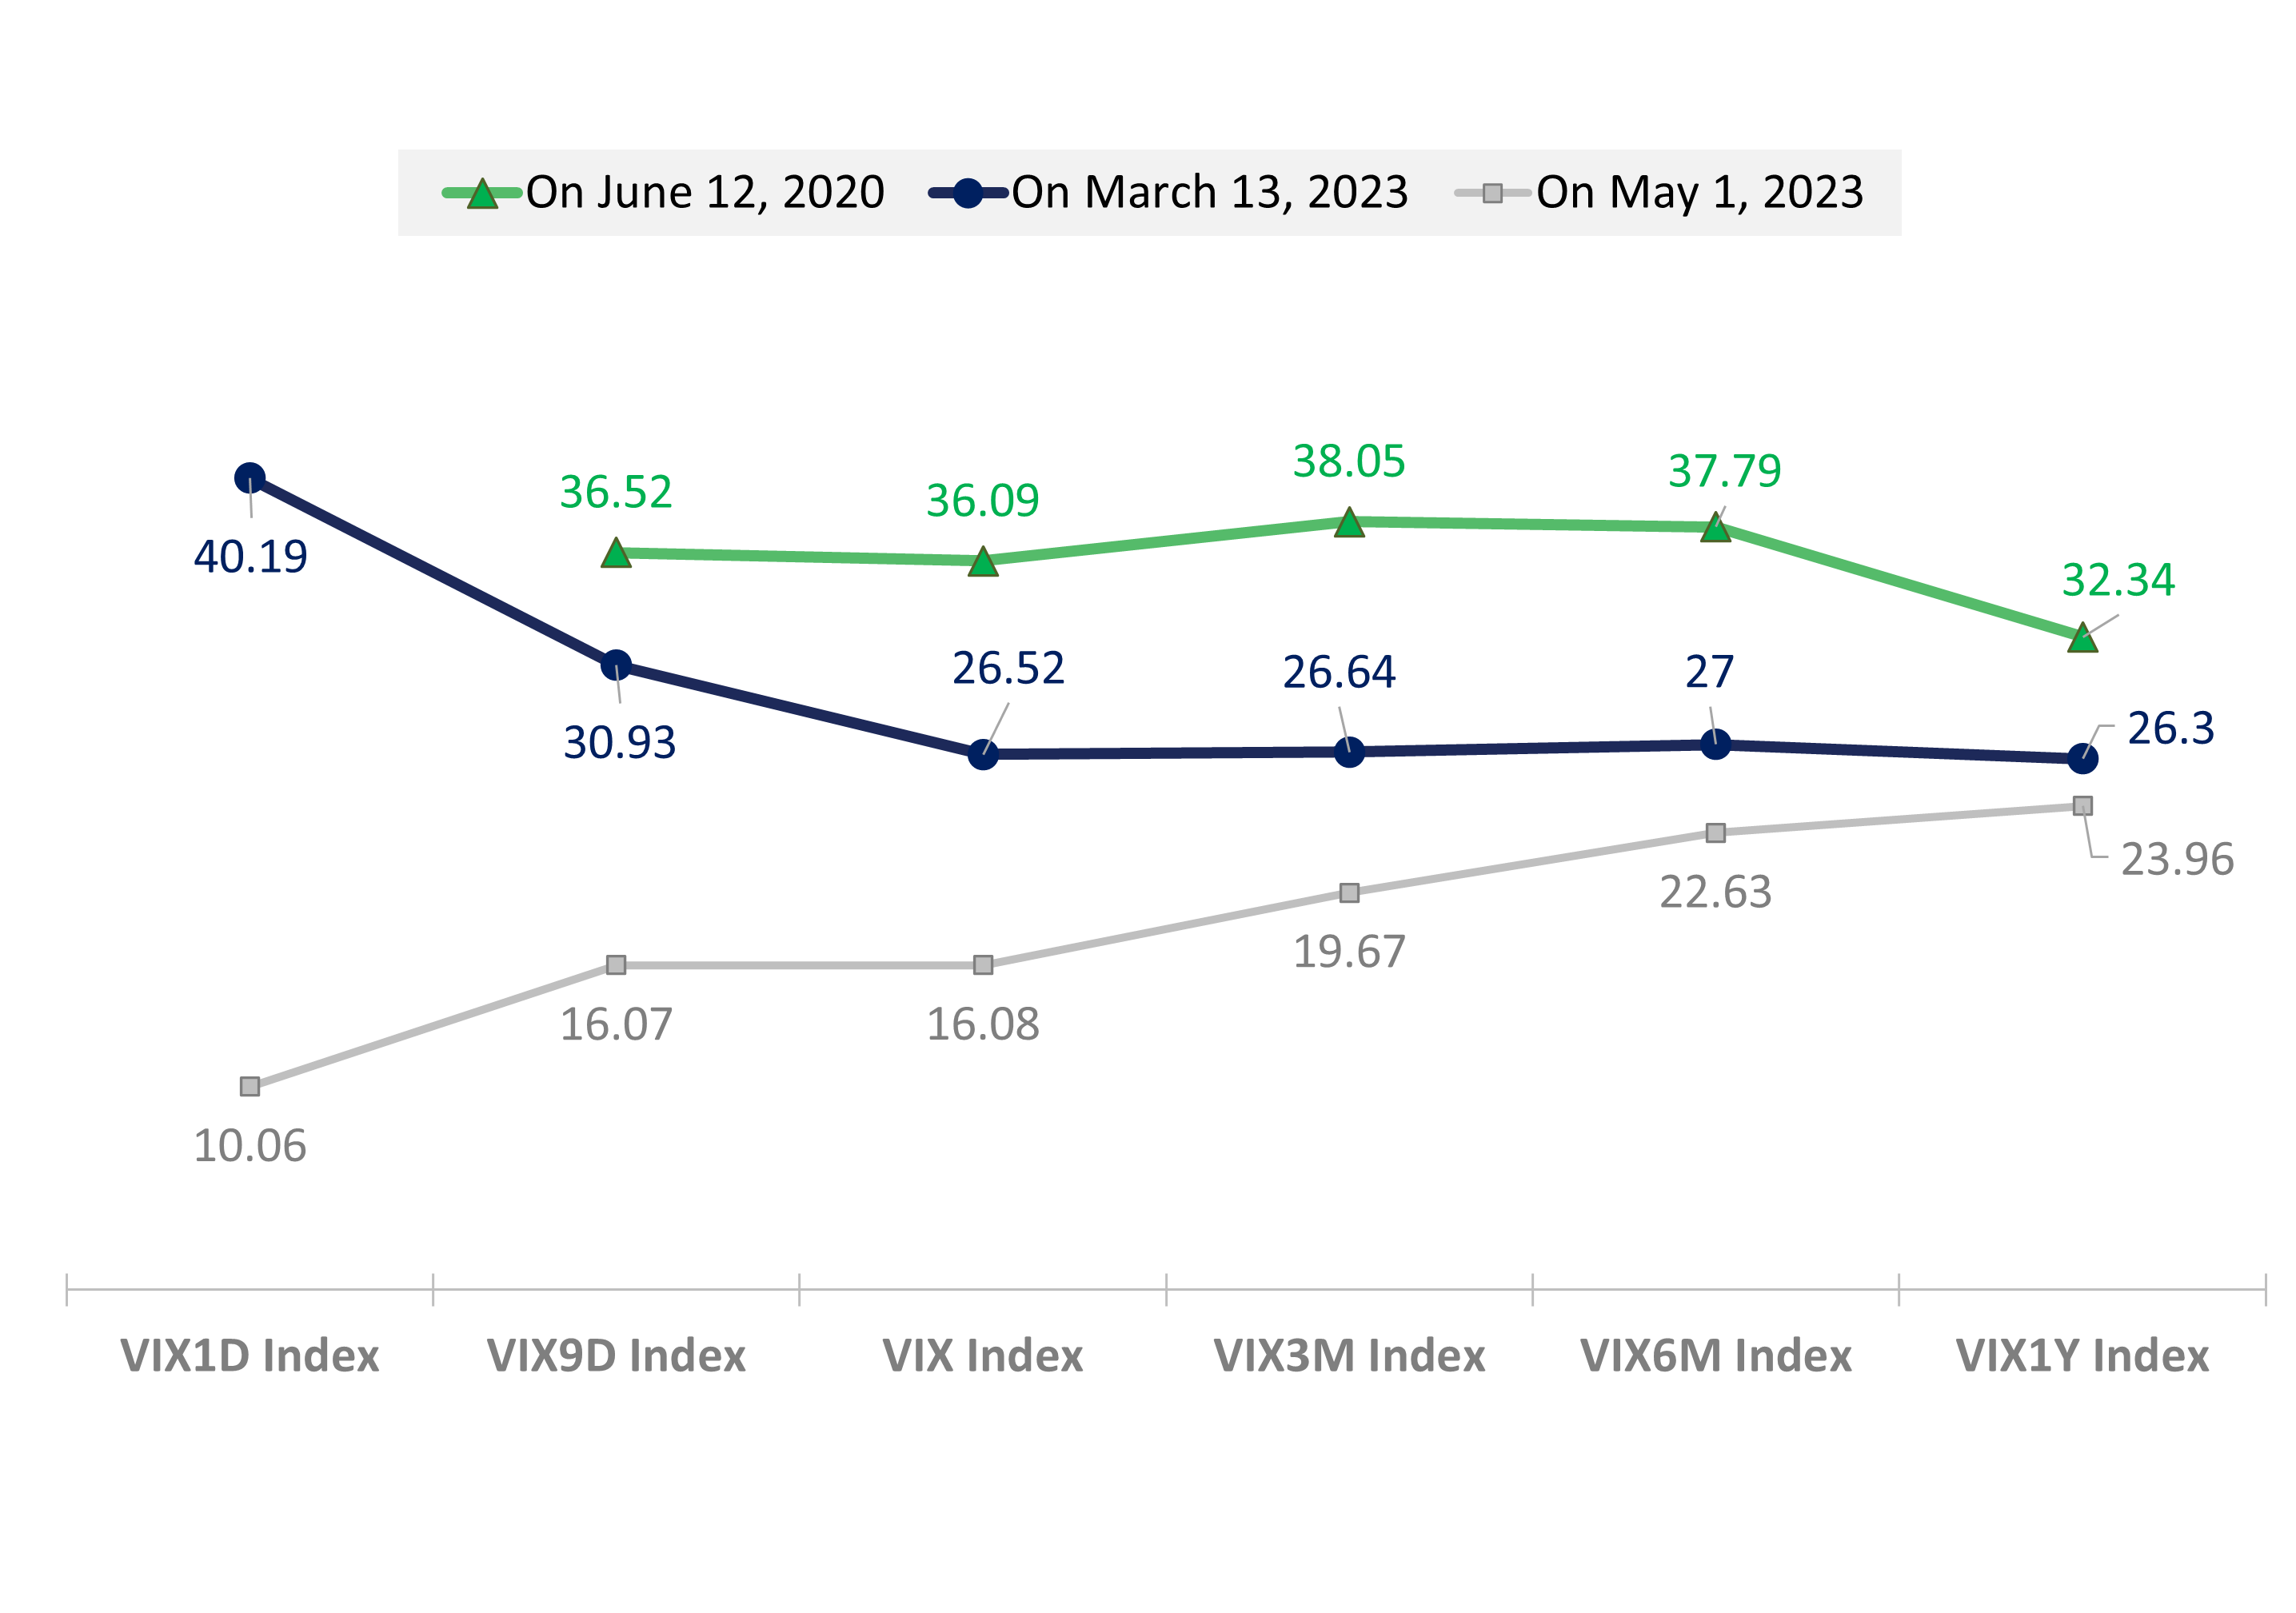
Cboe’s volatility indices can be helpful to investors who wish to gain insights on the term structure and the expectations for near-term and long-term volatility.
The chart below depicts the term structure of Cboe’s various volatility indices on three dates. On June 12, 2020, there was an “election bump” in the term structure for each index, presumably caused by concern about the possibility of heightened future volatility around the November 3, 2020, U.S. election. Since heightened future volatility was expected within the following few months around the election, the VIX3M and VIX 6M indices had higher values than the VIX9D, VIX and VIX1Y indices.
Source: Cboe Global Markets
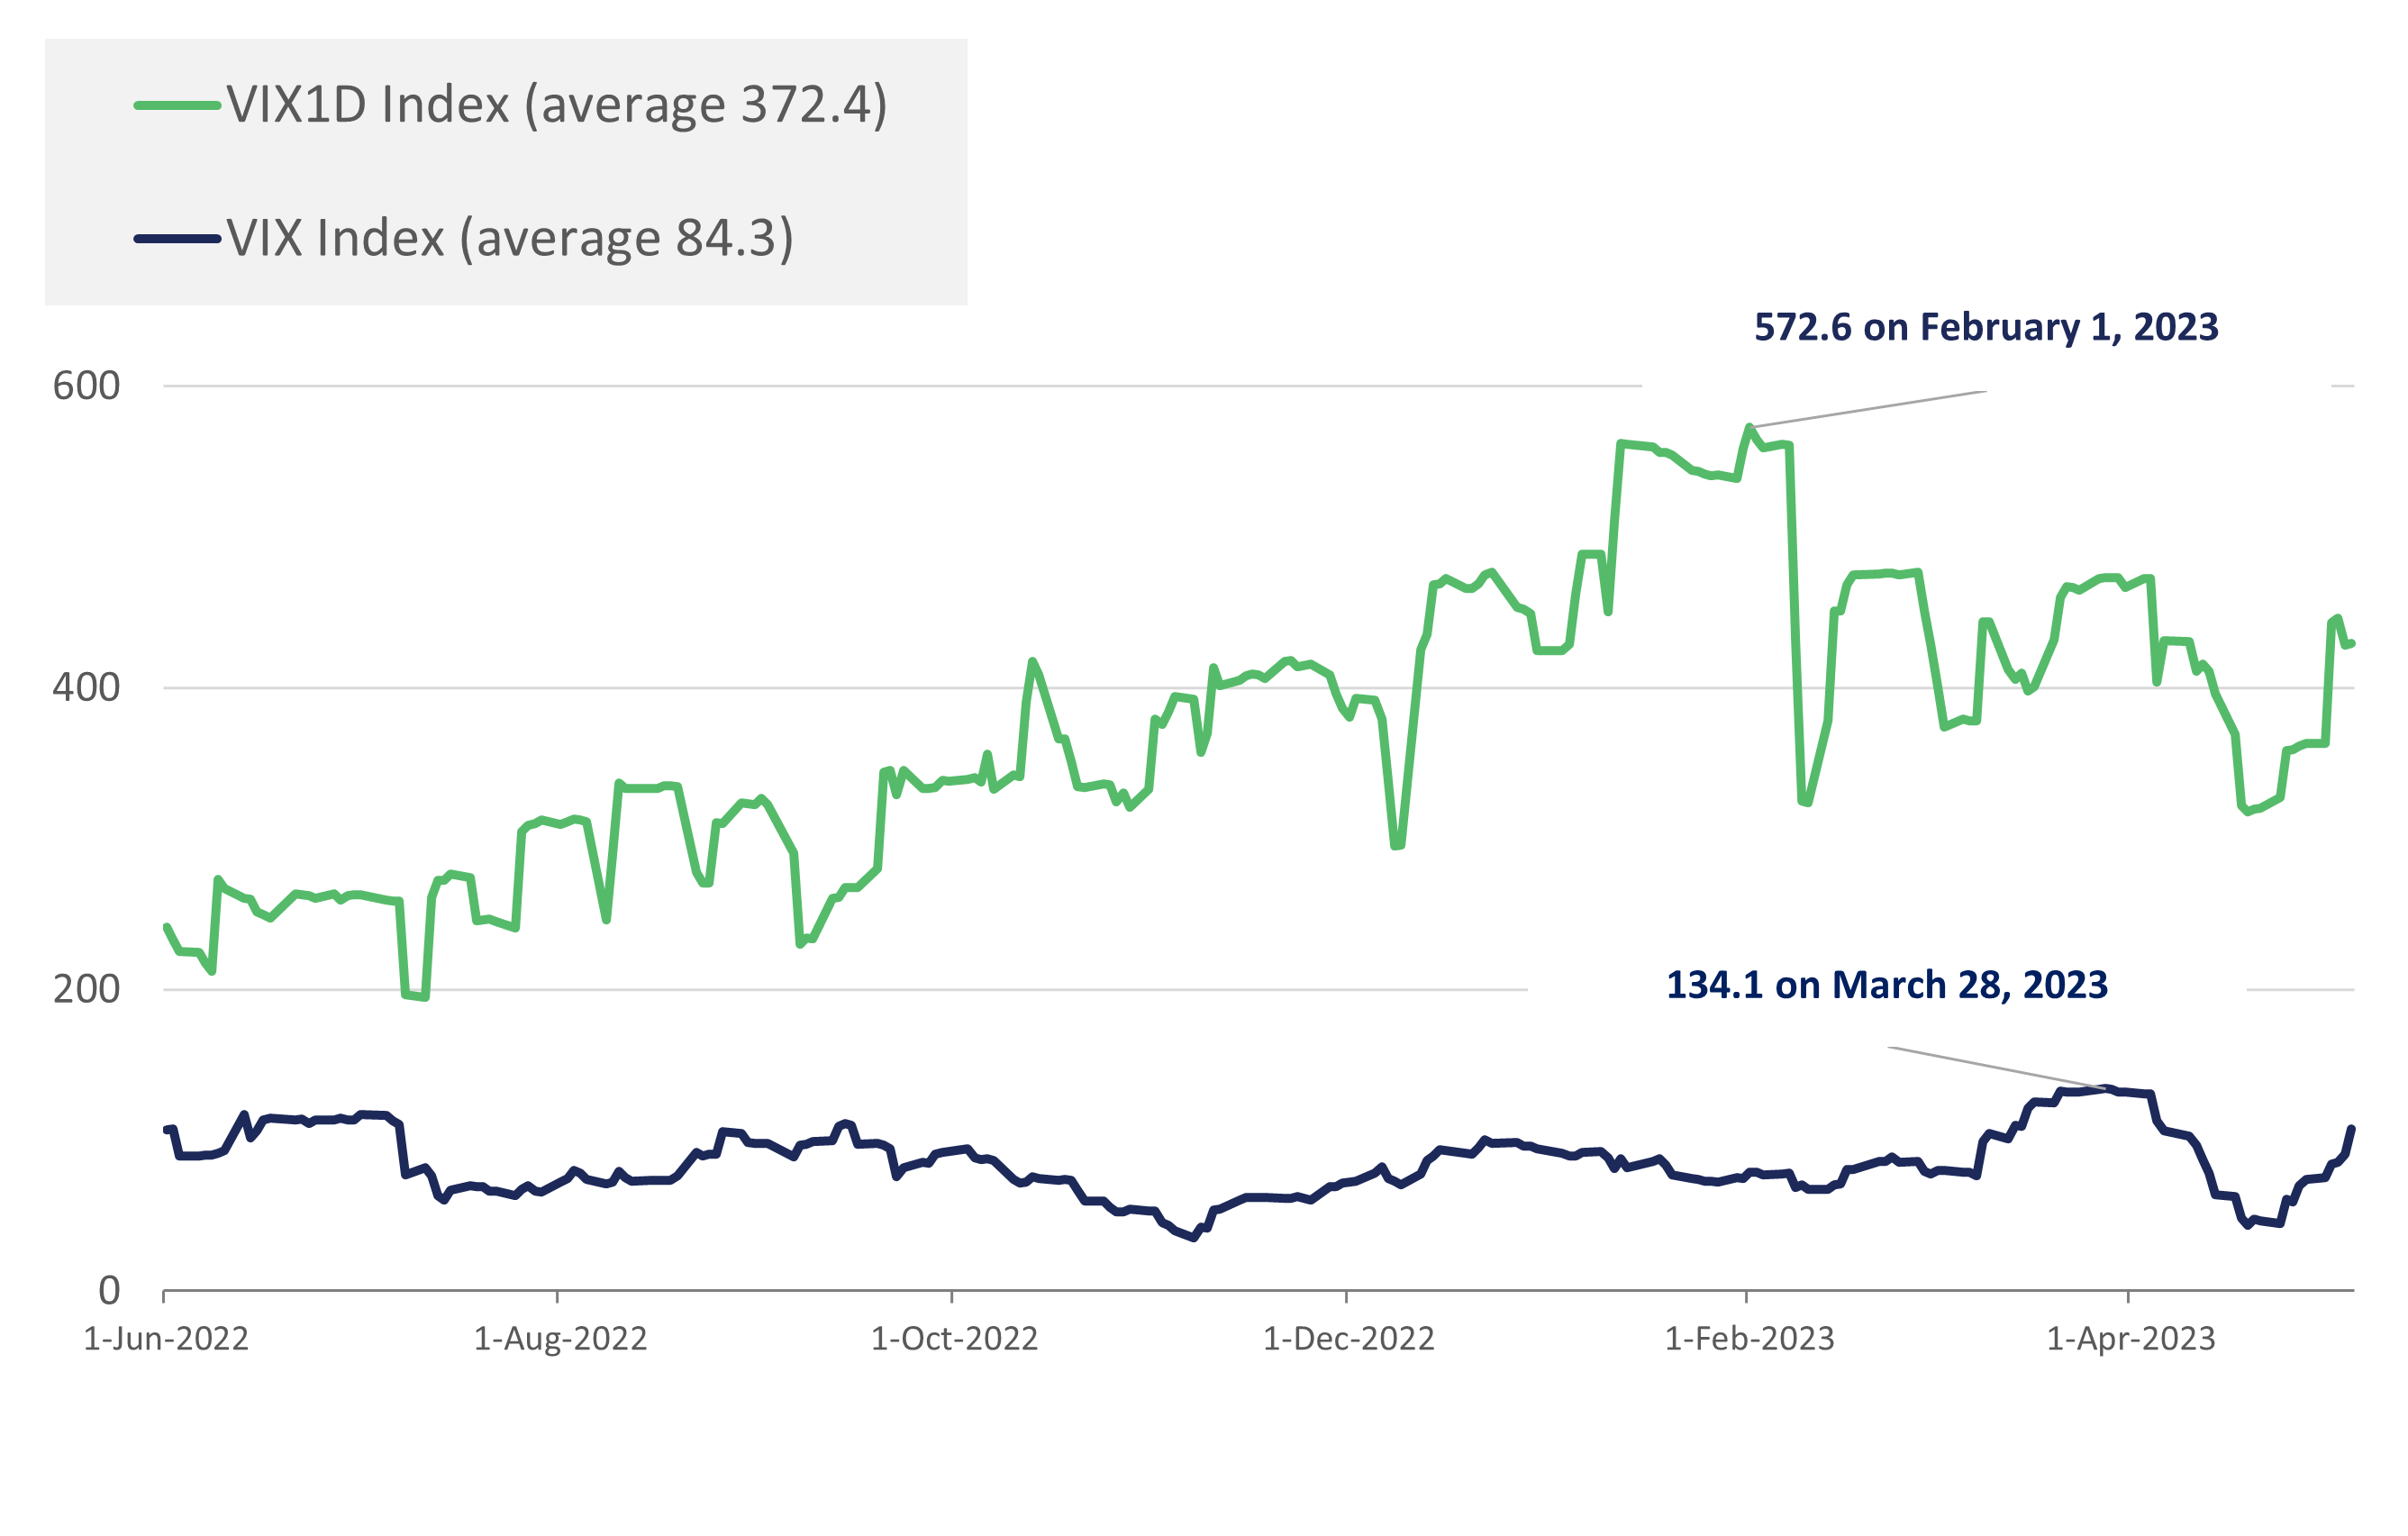
The average of the VIX1D Index 20-day historical volatility was 372.4, compared to an average of 84.3 for the VIX Index. As expected, the VIX1D Index is more volatile than any of the other indices listed because events that affect the S&P 500 Index on a given day are expected to have a larger impact in short-dated SPX options than in longer dated options when market participants have more time to react to the news event.
Average of 20-Day Historical Volatility for eight indices from June 1, 2022 - May 5, 2023
Source: Cboe Global Markets
Interestingly, the 20-day historical volatility for the VIX1D Index hit a daily closing high of 572.6 on February 1, 2023. Again, this is likely related to the FOMC meeting that occurred that day.
Average of 20-Day historical volatility from June 1, 2022 - May 5, 2022
Source: Cboe Global Markets
Between May 16, 2022, and May 10, 2023, the largest one-day percent increase for the VIX1D Index was 153.2% on January 11, 2023, followed by a move of 132.6% on December 11, 2022. Comparatively, the largest move for the VIX Index was 22.6% on June 13, 2022, followed by18.6% on May 18, 2022. Again, many of these moves came just before CPI or FOMC announcements. An indication of how these news events impact daily volatility.
May 16, 2022-May 10, 2023
Source: Cboe Global Markets
May 16, 2022-May 10, 2023
Source: Cboe Global Markets
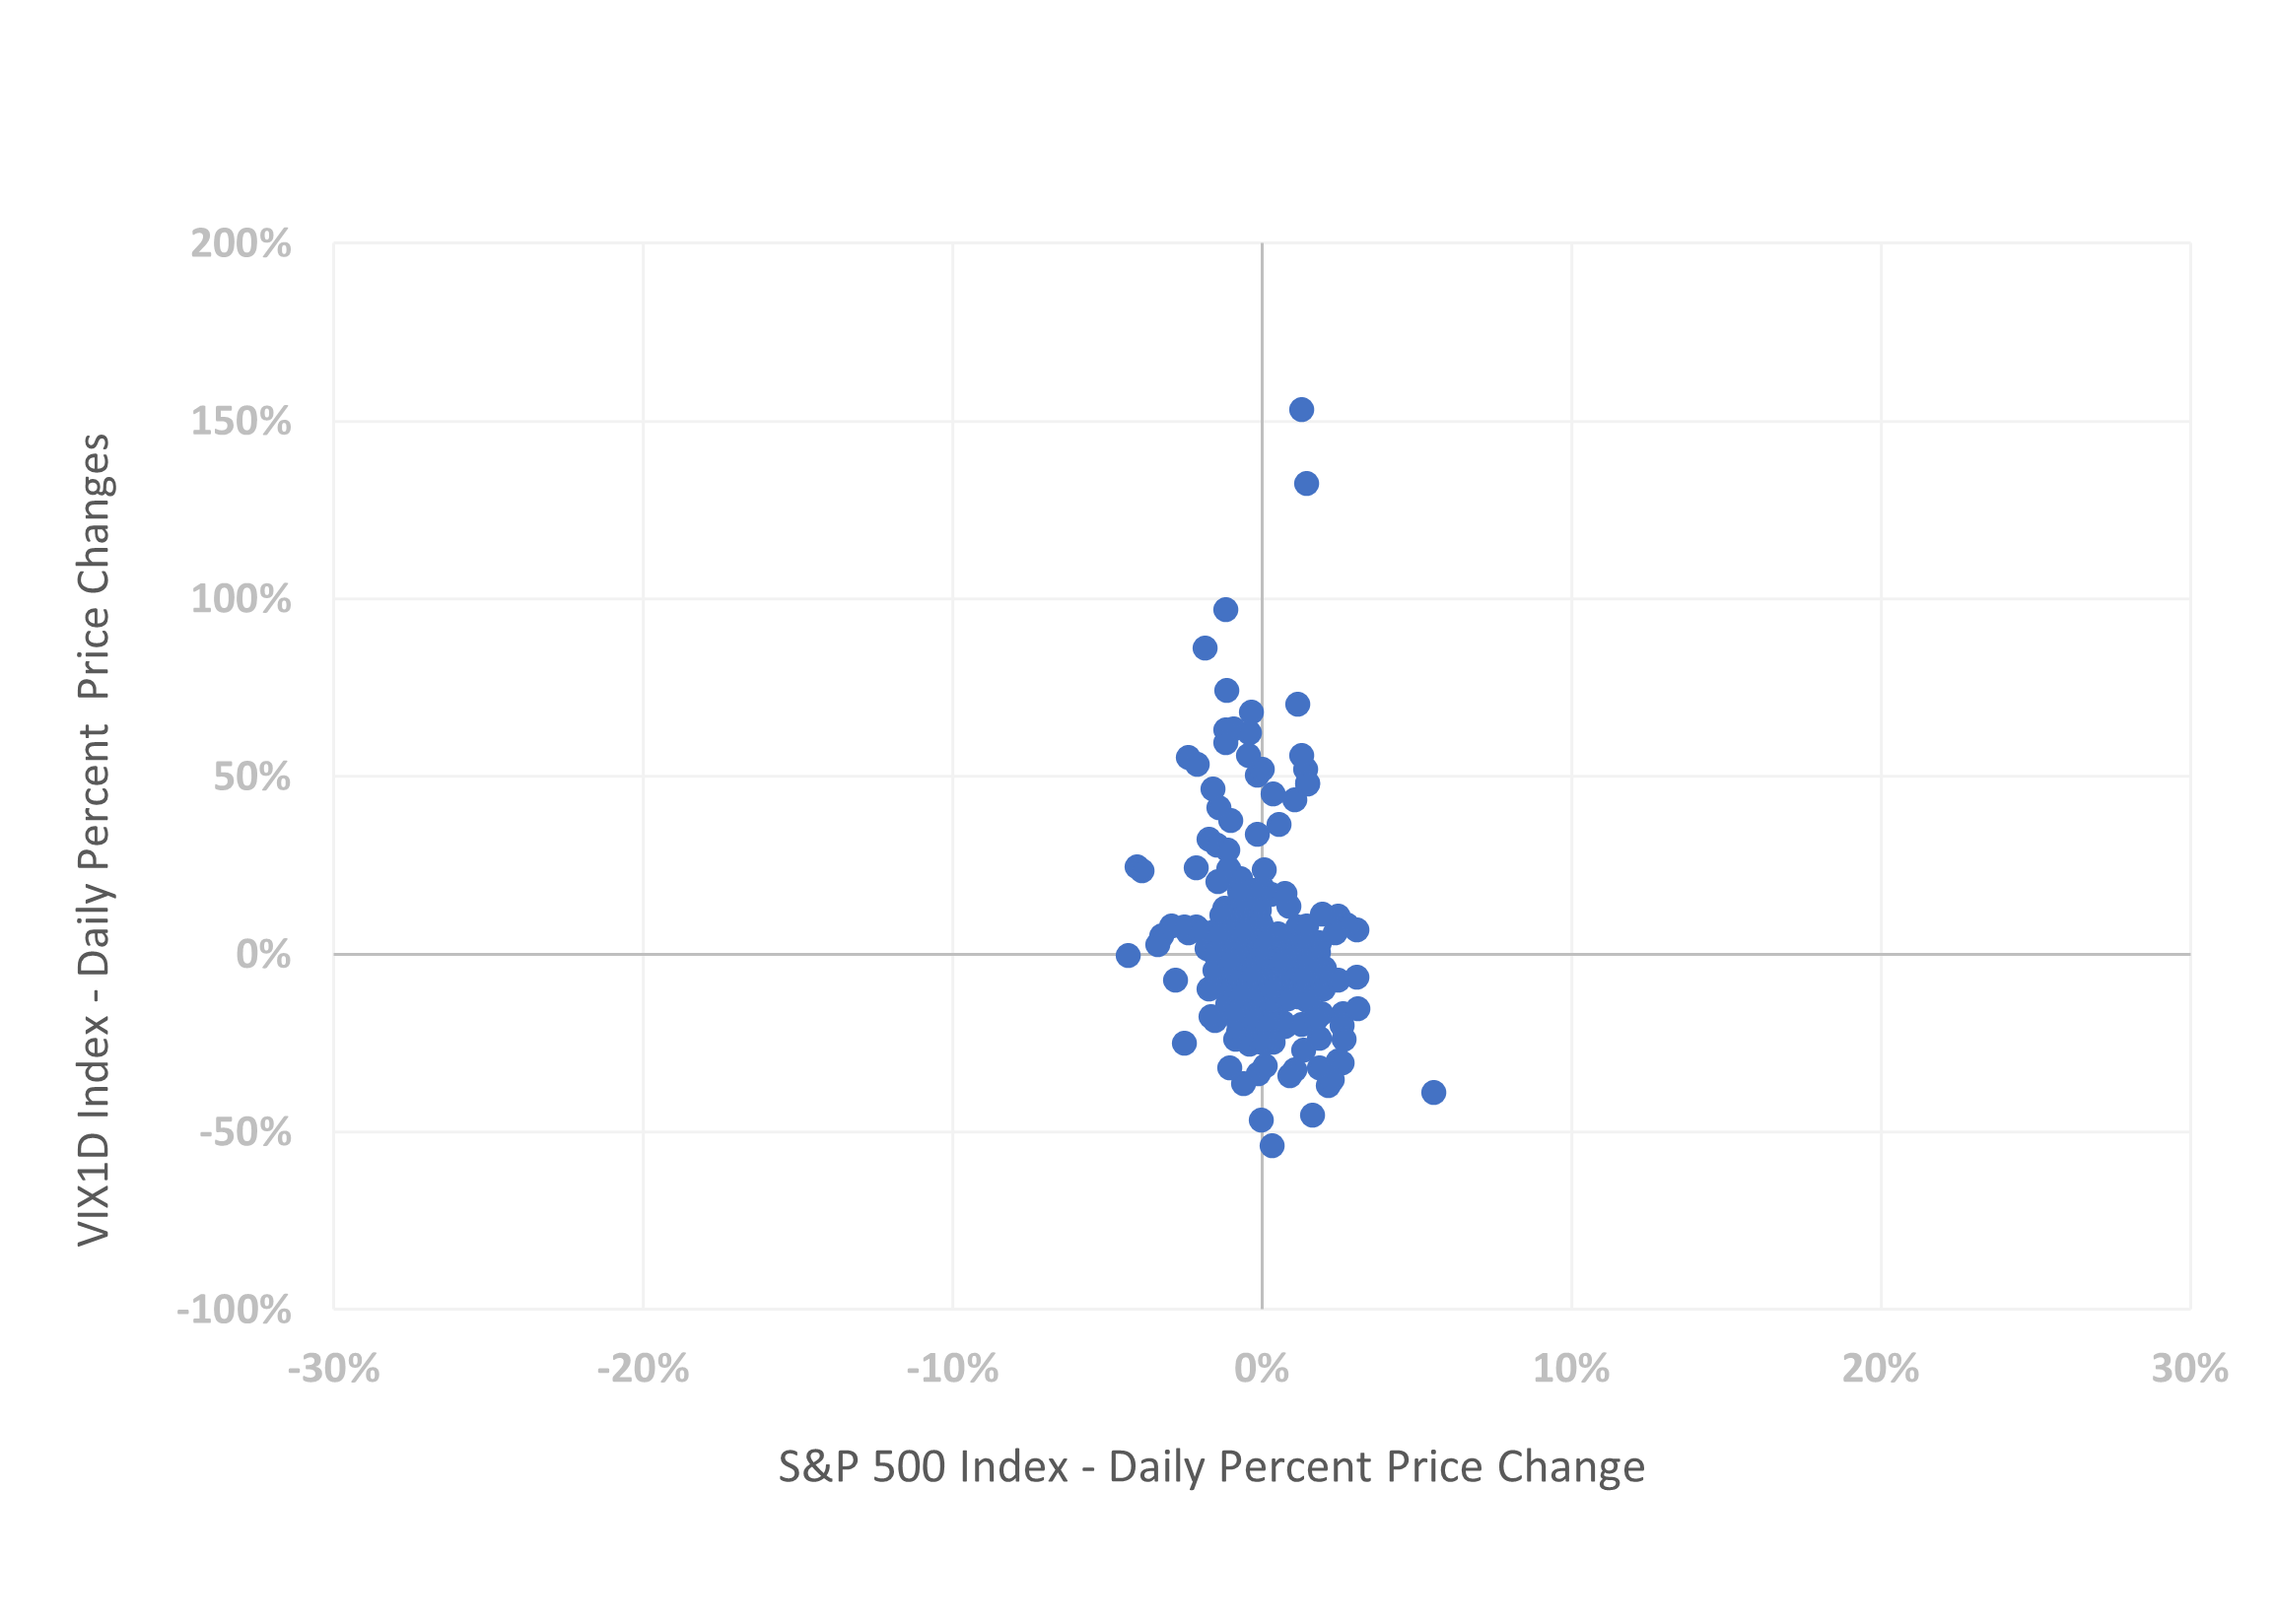
Typically, the returns of the S&P 500 Index and the VIX Index are negatively correlated. In fact, between May 2022 and May 2023, all seven volatility indices had negative daily returns, compared to the returns of the S&P 500 Index. While the correlations for some indices were significantly negative, with three below -0.70, the correlation between the VIX1D Index and the S&P 500 Index was only -0.20. Why isn’t the correlation between VIX1D Index and the SPX Index more negative? It is possibly because the VIX1D Index is designed to reflect one-day expected volatility and that its movements may be heavily impacted by near-term event risk, regardless of whether the SPX Index is rising or falling. For example, on January 31, 2023, the day before a U.S. FOMC announcement, the SPX Index rose 1.5%, the VIX Index fell 2.7%, and the VIX1D Index rose 47.9%. It appears that on January 31, 2023, the VIX1D Index may have been heavily impacted by the fact that the FOMC announcement of a rate hike was scheduled for the following day, whereas the VIX Index reflects 30-day expected volatility and likely would not be heavily impacted by such a near-term announcement.
May 16, 2022-May 5, 2023
Source: Cboe Global Markets
The scatterplot diagrams below convey the relationship between the performances of the VIX1D Index and S&P 500 Index. It’s worth noting that the VIX1D Index has had some convexity and that there have been instances when the SPX has had a loss, while the gain for the VIX1D Index was quite large.
May 16, 2022 - May 5, 2023
Source: Cboe Global Markets
May 16, 2022- May 5, 2023
Source: Cboe Global Markets
Source: Cboe Global Markets
Cboe’s indices are intended to serve as tools to help investors better understand what’s happening in the market. As trading in near-term options grows, it was important to provide an index that captured daily volatility. We believe the VIX1D Index can be a complementary addition for market participants seeking to better understand current equity market volatility or as they employ different trading strategies.
Learn more about Cboe Global Indices and related options and futures strategies:
There are important risks associated with transacting in any of the Cboe Company products or any digital assets discussed here. Before engaging in any transactions in those products or digital assets, it is important for market participants to carefully review the disclosures and disclaimers contained at: https://www.cboe.com/us_disclaimers/. These products and digital assets are complex and are suitable only for sophisticated market participants. These products involve the risk of loss, which can be substantial and, depending on the type of product, can exceed the amount of money deposited in establishing the position. Market participants should put at risk only funds that they can afford to lose without affecting their lifestyle. © 2023 Cboe Exchange, Inc. All Rights Reserved.

