Global Markets
Tradable Products
Featured Products

Back to European Equities Market Volume Summary
The European Equities Market Volume Summary pivot table allows users to arrange European venue market share data across all markets that are covered by Cboe Europe. The table is adjustable using these three key areas:

By default the data shown is for a single date, with values representing either the selected date or the average across a past date range ending at the selected date. If the selected date is the current date then the table will automatically refresh itself every 60 seconds. You can see the timestamp of the most recent data in the top-right corner. Use the calendar icon on the left side of the configuration bar to select a date to display. For each date you can view these date ranges:
A trading date is defined as a day during which any of the markets that Cboe Europe covers was open for trading.

Each data selection option (On-book, Off-book, etc.) represents a grouping of market data that is organised within industry-standard definitions. Each data group may have its own sub-groupings (categories, venues …), or the data could be shared across multiple sub-groupings.

All configuration changes made by the user are stored in the url. To share a link to what you’re seeing, simply copy and paste the url from the address bar.
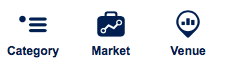
Category, Market and Venue allow users to select which of these items are displayed in the table. Only selected items will affect the totals, with the exception of Market, which allows you to toggle whether all markets should count towards the total with the ‘Include all markets in total’ checkbox.
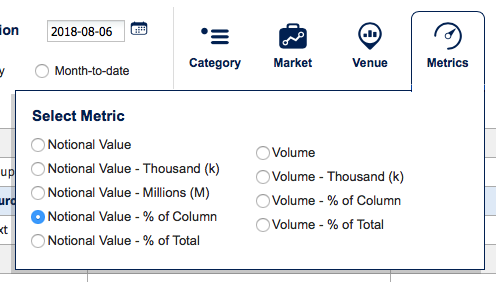
Metrics configures the type of market data being displayed in the table, and how it is formatted. Values can be shown as regular numbers or as percentages of either the column’s total or the table’s total.
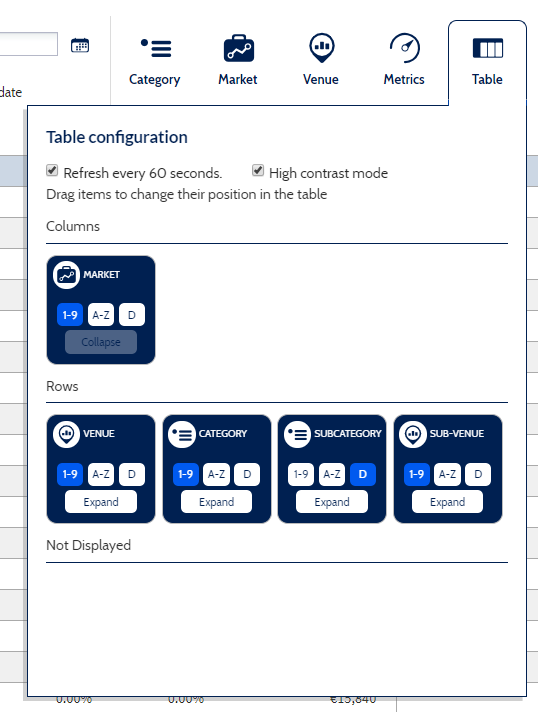
Table provides options for the display of the table. For each data selection option (Category, Venue, Market) users can choose:
The table displays market statistics according to the configuration specified by the data category and the options selected in the configuration bar. In addition to the user-defined configuration there are three additional columns present in the table:
Note that the total may not match up with the sum of all column values if the ‘Include all markets in total’ checkbox is selected.
Some rows have a down arrow: this allows for expansion of the row to drill down into that row’s sub-data.
Amounts may be represented as percentages or rounded up to the nearest thousand (k) or million (M). Hovering over each value will show you the full number. You can change this from the Metrics menu in the configuration bar.
The "Reports" menu allows you to download CSV files containing the source data for the table that is displayed on-screen. Note that the source data is unfiltered, so it will not change based on the selections made in the menus (Category, Venue, etc.). This data is provided in a 'flat' format (it always has the same columns) to make it easier to import into Microsoft Excel as a pivot table.
Note that each report link is based on the selected date, so the Month-To-Date report contents will vary depending on which date of the month is selected.