


Global Markets
Tradable Products
Featured Products

Guest Authors: Michael Cameron, Martin Vestergaard and Manjeet Mudan of Carmika Partners
Many investors were disappointed by the performance of long volatility strategies during the 2022 market sell off, despite increased realized volatility and an increased Cboe Volatility Index® (VIX® Index) — a benchmark that measures the market expectation of future realized volatility. Hedgers and tail risk funds were similarly dissatisfied. Although the VIX Index measured higher, the S&P 500® Index (SPX) option implied volatility decreased in the latest selloff, resulting in the underperformance of these strategies. However, Carmika Partners’ proprietary volatility model predicted that with SPX skew at all-time highs, a combination of long skew or long volatility was unlikely to work in a market downturn. How could investors have leveraged this model to inform their strategy?
To understand how option implied volatility can decrease as the VIX Index rises, it’s necessary to first understand what the VIX Index represents and its relation to actual option implied volatilities.
The VIX Index is a variance calculation, which means it is a weighted average of out-of-the-money options prices. To a first order approximation, the VIX Index can be thought of as proxy for at-the-money volatility (ATMV) of a constant 30 days to expiry term for S&P 500 Index options. Typically, the VIX Index is around 1.1-1.2 times ATMV. The reason for the spread between the VIX Index and ATMV is the skew of the volatility curve. For example, a 95% out-of-the-money put has a higher value than a 105% out-of-the-money call. The 95% put contributes more to the variance than the 105% call. Additionally, lower strike options are more heavily weighted than higher strike options in the variance calculation by a factor of 1/Strike2.
Figure 1 below shows volatility curves with different skews but the same ATMV, while Figure 2 shows the value of the corresponding VIX Index calculation. When skew is zero, the VIX Index is equal to ATMV. However, as the skew increases, so does the spread between the VIX Index and ATMV.
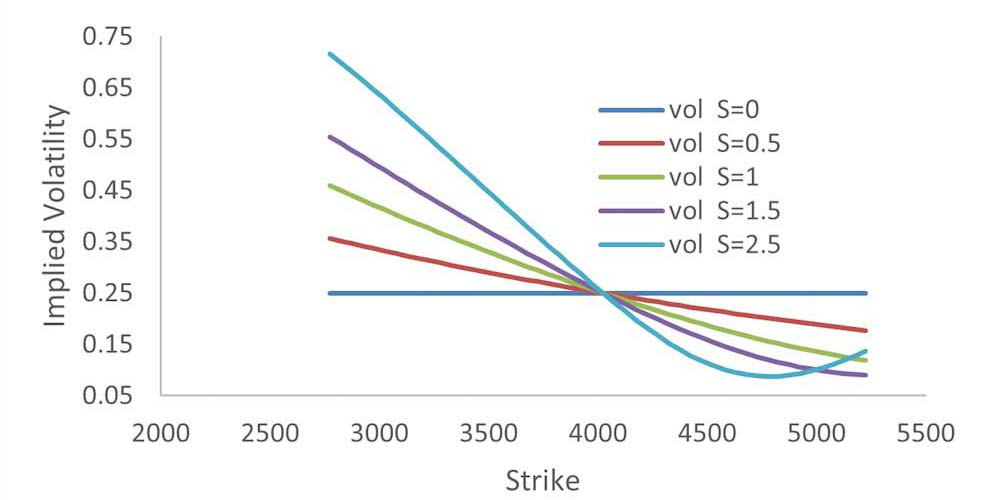

In addition to the level of ATMV, the level to skew also impacts the VIX Index. For example, in the case where ATMV is 25% and S is1.5, the level of the VIX Index is 27.9%.
The table below outlines a typical set of option implied volatilities for a series of strikes. If we make the assumption that option implied volatilities are unchanged as the market moves, then if the market fell to 3825, the ATMV would be 29.41 — the implied volatility of the 3825 strike — increasing from 25% to 29.41%. Given that the VIX Index is a proxy for ATMV, it may be expected it to increase by a similar amount, even though actual strike volatility is unchanged.
Source: Carmika Partners
There has been a large supply of volatility, or Vega, coming to market throughout this year’s selloff. As a result, the actual strike volatility has gone down. Under these conditions, the strike volatility of the 3825 strike may decrease to 29%. In the hypothetical case used above, if the VIX Index spread to ATMV remains constant, the VIX Index would increase to 31.9%. Additionally, the skew has declined from all-time highs to multi-year lows suppressing the spread between the VIX Index and ATMV. For an investor holding a long volatility, delta-hedged position in the 3825 strike, it is likely the position would actually lose value in the selloff, despite the VIX Index increasing. Figure 3 shows how the interpolated implied volatility of the 3825 strike for a constant 90-day maturity term has declined over the market selloff. This combination of lower volatility and lower skews is one of the main contributors to underperformance from tail risk funds in 2022 so far.
Source: Carmika Partners
Carmika Partners’ proprietary volatility model predicted that with SPX skew at all-time highs, a combination of long skew or long volatility was unlikely to work in a market downturn. This latest market selloff is more evidence that S&P 500 skew provides meaningful insight into investor positioning and behavioral biases. If analyzed correctly, it can help investors mitigate portfolio risks and complement implied volatility as a measure of risk.
Contact Us
Michael Cameron |Head of Investor Relations
(+44) 207 183 3146 | [email protected]
Martin Vestergaard | Partner
(+44) 207 183 3146 | [email protected]
Manjeet Mudan | Partner
(+44) 207 183 3146 | [email protected]
This article is part of Cboe’s Guest Author Series, where firms and individuals share their insights, strategies and ideas with the broader Cboe community. Interested in contributing? Email [email protected] or contact your Cboe representative to learn more.
There are important risks associated with transacting in any of the Cboe Company products or any of the digital assets discussed here. Before engaging in any transactions in those products or digital assets, it is important for market participants to carefully review the disclosures and disclaimers contained at: https://www.cboe.com/us_disclaimers/. The views expressed herein are those of the author and do not necessarily reflect the views of Cboe Global Markets, Inc. or any of its affiliates.

