


Inside Volatility Trading
“‘Tis impossible to be sure of any thing but Death and Taxes”
-Christopher Bullock (1716)
The “death and taxes” idiom traces its roots to the early 18th century play The Cobbler of Preston by Christopher Bullock. It has been referenced in many subsequent discourses by the likes of Daniel Defoe and Benjamin Franklin. Perhaps you’ve used the quip in recent weeks while preparing your annual statement of account for the government.
Certainty imbues this pithy statement. Death and taxes are certain.
I might add one other unavoidable certainty – volatility! Over the past couple of years, this piece has become a platform for analyzing and interpreting the inescapable idea of volatility.
Volatility just is.
Nothing remains constant, and in capital markets that change is synonymous with opportunity…and risk.
In my estimation, Chris Cole of Artemis Capital put it best:
“Volatility is no different in markets than it is in life. Volatility is an instrument of truth. Regardless of how it’s measured it reflects the difference between the world as we imagine it to be and the world that actually exists.”
So, what does the world look like now?
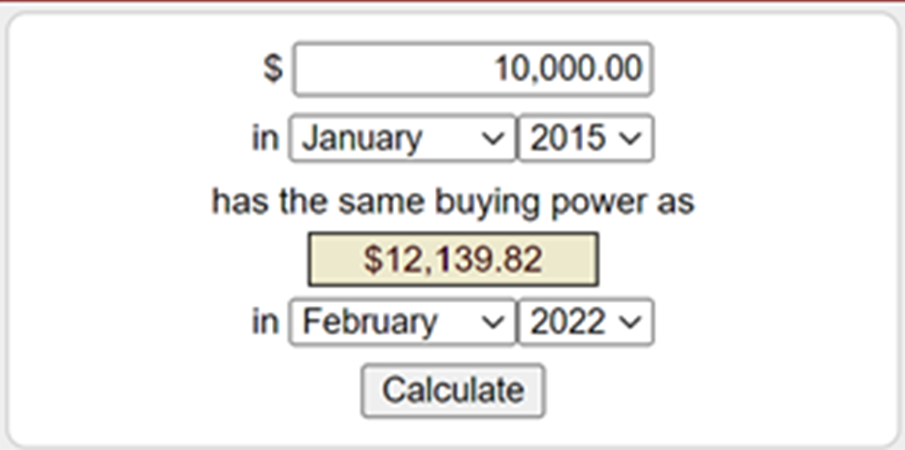
Living is more expensive these days. The Bureau of Labor Statistics’ (BLS) website has a CPI Inflation Calculator. As of February 2022, the calculator tells me I need $12,139.82 to buy what $10,000.00 purchased in January 2015. In other words, purchasing power has eroded by more than 20% over the past seven years.
Source: BLS
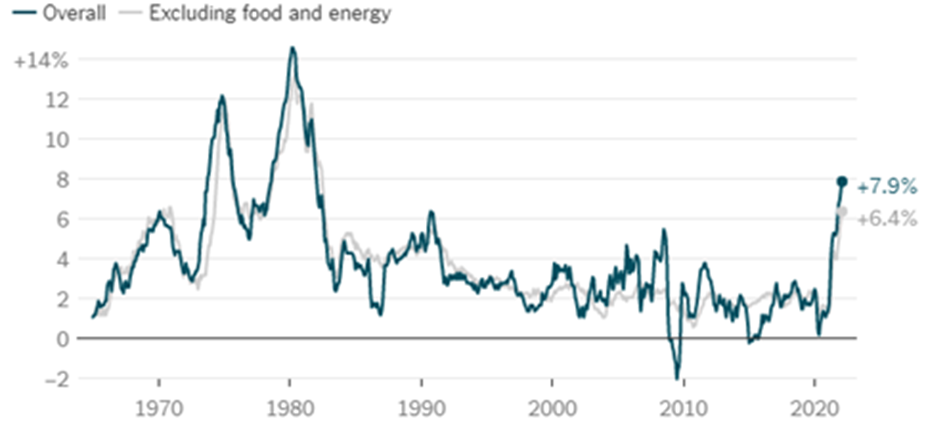
The CPI calculation has changed over time, but the BLS uses a weighted average of a basket of goods and services used by “households.” At present, the goods and services include things like food/beverages, housing, apparel, transportation, medical care, recreation, education, among others. The Core CPI data strips out the “volatile” food and energy costs.
Source: BLS & NY Times
The above chart plots the annual change in CPI (blue line) and the Core (grey line) dating back to 1965. The February data showed the largest annual inflation in 40 years. Inflation and market volatility are typically unsettling to consumers and long-term investors.
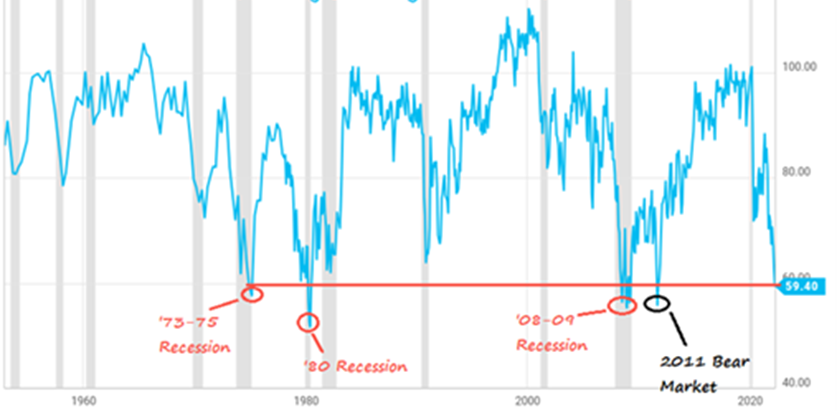
Concern about the recent ~15% decline in the S&P 500 Index and skyrocketing inflation is reflected in the University of Michigan’s Consumer Sentiment Index. Consumer spending accounts for about two-thirds of the U.S. economy. Government spending on things like defense, social security, and health care (Medicare, etc.) make up most of the other third.
There’s only been one other point in history where the UMich Sentiment was this low (59.4) and the economy was not in a recession: late 2011 at the height of European Sovereign debt crisis and following the only U.S. debt downgrade in history. Will the current backdrop with high inflation and tighter monetary conditions become the second exception? Let’s explore some other signals.
Source: University of Michigan, YCharts, Compound Advisors
Another harbinger of negative growth recently reared its unwelcome head. In early April the yield on 2-year U.S. treasuries exceeded the 10-year yield. That’s highly unusual. Let’s understand why.
The credit (bond) market is driven by risk – default – and duration (time). In general, if I choose to lend money for ten years, I expect a higher annual rate of return than if I lend funds for two years. Among other things, there’s more time for something to go awry. As such, the UST yield curve is typically in contango. That’s a familiar word for our readers, but to put it in this context (and for newer audiences), it means longer term interest rates are usually higher than short term rates. That premise underpins most of the financial system. Banks want to borrow at a low, short-term rate and lend longer term at a higher rate; the goal is to capture the spread or difference.
Similarly, the term structure for VIX futures is generally contango. Volatility futures that expire eight or more months in the future tend to trade at a premium to futures with a one-month maturity. Why? There’s more time for something to go wrong.
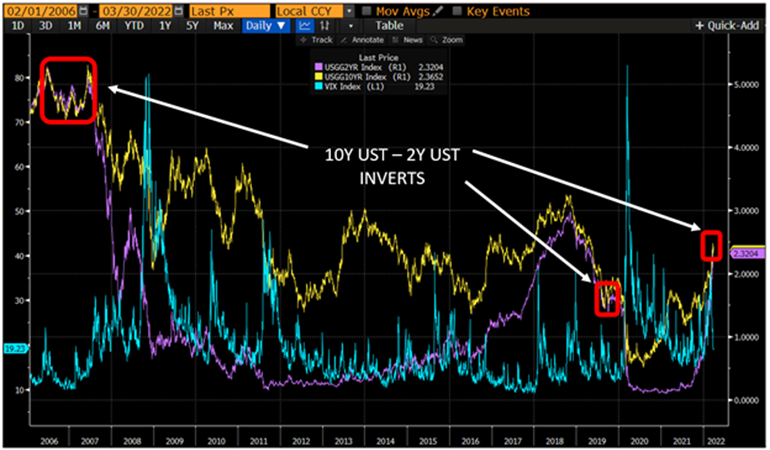
The chart below plots the yield for both the US 10Y (yellow) and US 2Y (purple) with the VIX Index (teal) overlay. The 10/2 spread was inverted between late 2006 and much of 2007. Another inversion occurred in the fall of 2019. Both situations preceded historic moves higher in the VIX Index. If you go back more than two decades, a 10/2 inversion occurred in late 1999 before the subsequent “dot com” bust.
Source: Bloomberg
But let’s not confuse correlation with causation. Interest rate spreads could not anticipate a global pandemic. This does not imply that a significant rise in the VIX index is bound to occur. However, the last few times the yield spread went negative was followed by periods of (much) higher than normal equity volatility.
Well, ‘praemonitus, praemunitus’ – more commonly – ‘forewarned, forearmed.’ This piece isn’t prescriptive, but rather serves as an attempt to call attention to interesting data and related concepts that increase investor IQ.
There are tools at our disposal that may mitigate future uncertainty, but as with any tool there are associated risks. What tools might you consider given the current backdrop?
Historically, potential inflation hedges (assets that may move higher when inflation increases/purchasing power declines) include commodities, real estate, and Treasury-Inflation Protected Securities (TIPS). Broadly speaking, commodities, and real estate are finite, meaning their availability is limited. However, those markets have already made significant moves to the upside.
By contrast, the VIX index have declined lately. The VIX Index is much closer to where it measured before inflation became a primary risk. The “normalization” of S&P 500 Index implied volatility levels stands out when compared to other forward-looking measures.
The tradeable suite of VIX products (futures and options) are also often considered hedges. The historically strong inverse relationship between the S&P 500 level and VIX Index (as well as related futures) drives their appeal. Put simply, when the S&P 500 Index declines, the VIX Index and tradeable futures tend to move higher. A hedge, in capital markets, should move in the opposite direction of the primary risk asset.
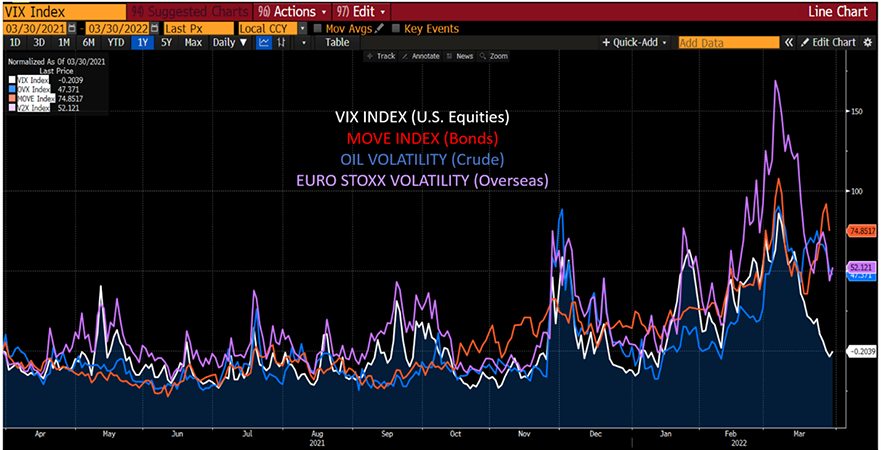
Over the year, but particularly in recent weeks, the VIX Index and related products have diverged from other volatility measures. This chart shows the percent change in various volatility measures relative to a year ago. The VIX Index is slightly lower whereas a bond volatility proxy (MOVE Index) is up 74%. Euro Stoxx 50 Index volatility is more than 50% higher than it was in late March 2021. Crude oil volatility is up 47% relative to this time last year.
Source: Bloomberg
This reminds me of a saying my first risk manager would repeat: “something is only cheap (or expensive) relative to itself or something else.” Looking back a decade, the ratio between bond market volatility and the VIX Index is above the 90th percentile. The relationship between the VIX Index and crude oil volatility is also in the +90%. The divergence between Euro Stoxx Index and VIX Index volatility is even greater. (Source: Chris Murphy, SIG International)
As of late March, the VIX Index seems “cheap” relative to some other forward risk measures.
For U.S. residents, Monday April 18 is the deadline for filing your 2021 tax returns or an extension. The Internal Revenue Code is roughly 2,500 pages long. That’s about twice the length of Leo Tolstoy’s epic War and Peace. Translation, it’s dense.
Under section 1256 of the Tax Code, profit and loss on transactions in certain exchange-traded options and futures are entitled to be taxed at a rate equal to 60% long-term and 40% short-term capital gain or loss, provided that the market participants involved, and the strategy employed satisfy the criteria of the Tax Code. Market participants should consult with their tax advisors to determine how the profit and loss on any particular option or futures strategy will be taxed. Tax laws and regulations change from time to time and may be subject to varying interpretations.
Very few people are thrilled by the thought of filing taxes, but in this case, there can be a meaningful implication for certain products.
This is my final iteration of Inside Volatility. I’ve thoroughly enjoyed the opportunity to evaluate the markets with an emphasis on volatility during my time at Cboe. I’ve learned so much from colleagues past and present. There’s always something new to understand, and there is a piece of each of them in all my work.
Thomas Wolfe penned You Can’t Go Home Again in the late 1930s, but my experience argues otherwise. My professional life began in the fall of 1999 when I stepped on the Cboe trading floor, and a new world emerged for me. I was introduced to a new language, to new tools. The volatility embedded in calls and puts changed my life, as options reinforced the reality that change is constant. The velocity of change can be significant or minimal. Volatility just is.
In late 2015, I came home again – to Cboe, this time as a part of the Options Institute (OI). I watched the derivative markets flourish and contributed to the expansion of the OI. I experienced new life when my first and only child was born. I encountered death when my dad passed away from brain cancer. Change is constant.
To best manage change, I encourage you to keep learning and observing. The Options Institute is excited to continue to offer ways to help you do this as you explore and engage in the world of financial derivatives.
Thank you all for your readership and support.
“Volatility (can) hurt but is necessary for growth. In nature volatility is so fundamental that the trees of the great sequoia forest will not release their seeds without first sensing heat from wildfires. It is from the flames of change that we derive the potential for healthy resurrection and birth.”
-Chris Cole
All things must pass
None of life’s strings can last
So, I must be on my way and face another day
-George Harrison

Get the Inside Volatility Trading newsletter directly in your inbox by signing up here.
There are important risks associated with transacting in any of the Cboe Company products discussed here. Before engaging in any transactions in those products, it is important for market participants to carefully review the disclosures and disclaimers below.
General
The information provided is for general education and information purposes only. No statement provided should be construed as a recommendation to buy or sell a security, future, financial instrument, investment fund, or other investment product (collectively, a “financial product”), or to provide investment advice.
In particular, the inclusion of a security or other instrument within an index is not a recommendation to buy, sell, or hold that security or any other instrument, nor should it be considered investment advice.
Options
Options involve risk and are not suitable for all market participants. Prior to buying or selling an option, a person should review the Characteristics and Risks of Standardized Options (ODD) , which is required to be provided to all such persons. Copies of the ODD are available from your broker or from The Options Clearing Corporation, 125 S. Franklin Street, Suite 1200, Chicago, IL 60606.
Trading FLEX options may not be suitable for all options-qualified market participants. FLEX options strategies only should be considered by those with extensive prior options trading experience.
Uncovered option writing is suitable only for the knowledgeable market participant who understands the risks, has the financial capacity and willingness to incur potentially substantial losses, and has sufficient liquid assets to meet applicable margin requirements. In this regard, if the value of the underlying instrument moves against an uncovered writer's options position, the writer may incur large losses in that options position and the participant’s broker may require significant additional margin payments. If a market participant does not make those margin payments, the broker may liquidate positions in the market participant’s account with little or no prior notice in accordance with the market participant’s margin agreement.
Futures
Futures trading is not suitable for all market participants and involves the risk of loss, which can be substantial and can exceed the amount of money deposited for a futures position. You should, therefore, carefully consider whether futures trading is suitable for you in light of your circumstances and financial resources. You should put at risk only funds that you can afford to lose without affecting your lifestyle.
For additional information regarding the risks associated with trading futures and security futures, see respectively the Risk Disclosure Statement set forth in Appendix A to CFTC Regulation 1.55(c) and the Risk Disclosure Statement for Security Futures Contracts.
VIX® Index and VIX® Index Products
The Cboe Volatility Index® (known as the VIX Index) is calculated and administered by Cboe Global Indices, LLC. The VIX Index is a financial benchmark designed to be a market estimate of expected volatility of the S&P 500® Index, and is calculated using the midpoint of quotes of certain S&P 500 Index options as further described in the methodology, rules and other information here .
VIX futures and Mini VIX futures, traded on Cboe Futures Exchange, LLC, and VIX options, traded on Cboe Options Exchange, Inc. (collectively, “VIX® Index Products”), are based on the VIX Index. VIX Index Products are complicated financial products only suitable for sophisticated market participants.
Transacting in VIX Index Products involves the risk of loss, which can be substantial and can exceed the amount of money deposited for a VIX Index Product position (except when buying options on VIX Index Products, in which case the potential loss is limited to the purchase price of the options).
Market participants should put at risk only funds that they can afford to lose without affecting their lifestyles.
Before transacting in VIX Index Products, market participants should fully inform themselves about the VIX Index and the characteristics and risks of VIX Index Products, including those described here. Market participants also should make sure they understand the product specifications for VIX Index Products ( VIX futures , Mini VIX futures and VIX options ) and the methodologies for calculating the underlying VIX Index and the settlement values for VIX Index Products. Answers to questions frequently asked about VIX Index products and how they are settled is available here .
Not Buy and Hold Investment: VIX Index Products are not suitable to buy and hold because:
Volatility: The VIX Index is subject to greater percentage swings in a short period of time than is typical for stocks or stock indices, including the S&P 500 Index.
Expected Relationships: Expected relationships with other financial indicators or financial products may not hold. In particular:
Final settlement Value: The method for calculating the final settlement value of a VIX Index Product is different from the method for calculating the VIX Index at times other than settlement, so there can be a divergence between the final settlement value of a VIX Index Product and the VIX Index value immediately before or after settlement. (See the SOQ Auction Information section here for additional information.)
Exchange Traded Products ("ETPs")
Cboe does not endorse or sell any ETP or other financial product, including those investment products that are or may be based on a Cboe index or methodology or on a non-Cboe index that is based on investment products trading on a Cboe Company exchange (e.g., VIX futures); and Cboe makes no representations regarding the advisability of investing in such products. An investor should consider the investment objectives, risks, charges, and expenses of these products carefully before investing. Investors also should carefully review the information provided in the prospectuses for these products.
Investments in ETPs involve risk, including the possible loss of principal, and are not appropriate for all investors. Non-traditional ETPs, including leveraged and inverse ETPs, pose additional risks and can result in magnified gains or losses in an investment. Specific risks relating to investment in an ETP are outlined in the fund prospectus and may include concentration risk, correlation risk, counterparty risk, credit risk, market risk, interest rate risk, volatility risk, tracking error risk, among others. Investors should consult with their tax advisors to determine how the profit and loss on any particular investment strategy will be taxed.
Cboe Strategy Benchmark Indices
Cboe Strategy Benchmark Indices are calculated and administered by Cboe Global Indices, LLC as described in the methodologies, rules and other information available here using information believed to be reliable, including market data from exchanges owned and operated by other Cboe Companies.
Strategy Benchmark Indices are designed to measure the performance of hypothetical portfolios comprised of one or more derivative instruments and other assets used as collateral. Past performance is not indicative of future results. Strategy Benchmark Indices are not financial products that can be invested in directly, but can be used as the basis for financial products or managing portfolios.
The actual performance of financial products such as mutual funds or managed accounts can differ significantly from the performance of the underlying index due to execution timing, market disruptions, lack of liquidity, brokerage expenses, transaction costs, tax consequences and other considerations that may not be applicable to the subject index. Index and Benchmark Values Prior to Launch Date
Index and benchmark values for the period prior to an index’s launch date are calculated by a theoretical approach involving back-testing historical data in accordance with the methodology in place on the launch date (unless otherwise stated). A limitation of back-testing is that it reflects the theoretical application of the index or benchmark methodology and selection of the index’s constituents in hindsight. Back-testing may not result in performance commensurate with prospective application of a methodology, especially during periods of high economic stress in which adjustments might be made. No back-tested approach can completely account for the impact of decisions that might have been made if calculations were made at the same time as the underlying market conditions occurred. There are numerous factors related to markets that cannot be, and have not been, accounted for in the preparation of back-tested index and benchmark information.
Taxes
No Cboe Company is an investment adviser or tax advisor, and no representation is made regarding the advisability or tax consequences of investing in, holding or selling any financial product. A decision to invest in, hold or sell any financial product should not be made in reliance on any of the statements or information provided. Market participants are advised to make an investment in, hold or sell any financial product only after carefully considering the associated risks and tax consequences, including information detailed in any offering memorandum or similar document prepared by or on behalf of the issuer of the financial product, with the advice of a qualified professional investment adviser and tax advisor.
Under section 1256 of the Tax Code, profit and loss on transactions in certain exchange-traded options and futures are entitled to be taxed at a rate equal to 60% long-term and 40% short-term capital gain or loss, provided that the market participants involved and the strategy employed satisfy the criteria of the Tax Code. Market participants should consult with their tax advisors to determine how the profit and loss on any particular option or futures strategy will be taxed. Tax laws and regulations change from time to time and may be subject to varying interpretations.
General
Past performance of an index or financial product is not indicative of future results.
Brokerage firms may require customers to post higher margins than any minimum margins specified.
No data, values or other content contained in this document (including without limitation, index values or information, ratings, credit-related analyses and data, research, valuations, strategies, methodologies and models) or any part thereof may be modified, reverse-engineered, reproduced or distributed in any form or by any means, or stored in a database or retrieval system, without the prior written permission of Cboe.
Cboe does not guarantee the accuracy, completeness, or timeliness of the information provided. THE CONTENT IS PROVIDED “AS IS” WITHOUT WARRANTY OF ANY KIND, EITHER EXPRESS OR IMPLIED, INCLUDING, WITHOUT LIMITATION, ANY WARRANTY WITH RESPECT MERCHANTABILITY OR FITNESS FOR A PARTICULAR PURPOSE.
Hypothetical scenarios are provided for illustrative purposes only. The actual performance of financial products can differ significantly from the performance of a hypothetical scenario due to execution timing, market disruptions, lack of liquidity, brokerage expenses, transaction costs, tax consequences and other considerations that may not be applicable to the hypothetical scenario.
Supporting documentation for statements, comparisons, statistics or other technical data provided is available by contacting Cboe at www.cboe.com/Contact .
The views of any third-party speakers or third-party materials are their own and do not necessarily represent the views of any Cboe Company. That content should not be construed as an endorsement or an indication by Cboe of the value of any non-Cboe financial product or service described.
The inclusion of research not conducted or explicitly endorsed by Cboe should not be construed as an endorsement or indication of the value of that research.
Trademarks and Intellectual Property
Cboe®, Cboe Global Markets®, Bats®, BIDS Trading®, BYX®, BZX®, Cboe Options Institute®, Cboe Vest®, Cboe Volatility Index®, CFE®, EDGA®, EDGX®, Hybrid®, LiveVol®, Silexx® and VIX® are registered trademarks, and Cboe Futures ExchangeSM, C2SM, f(t)optionsSM, HanweckSM, and Trade AlertSM are service marks of Cboe Global Markets, Inc. and its subsidiaries. Standard & Poor's®, S&P®, S&P 100®, S&P 500® and SPX® are registered trademarks of Standard & Poor's Financial Services LLC and have been licensed for use by Cboe Exchange, Inc. Dow Jones®, Dow Jones Industrial Average®, DJIA® and Dow Jones Global Indexes® are registered trademarks or service marks of Dow Jones Trademark Holdings, LLC, used under license. Russell, Russell 1000®, Russell 2000®, Russell 3000® and Russell MidCap® names are registered trademarks of Frank Russell Company, used under license. FTSE® and the FTSE indices are trademarks and service marks of FTSE International Limited, used under license. MSCI and the MSCI index names are service marks of MSCI Inc. (“MSCI”) or its affiliates and have been licensed for use by Cboe. All other trademarks and service marks are the property of their respective owners.
Copyright
© 2022 Cboe Exchange, Inc. All Rights Reserved.

