
Visibility is not something I consider often, but I am bound by gravitational forces. In aviation, visibility is a measure of the distance at which an object or light can be clearly discerned. Take off and initial climb as well as approach and landing for aircraft are directly impacted by visibility.
In capital markets, visibility is also paramount. Markets look forward and the degree to which the future appears clear impacts the willingness of market participants to remain “in flight” (invested). When visibility becomes limited, some market participants look for the nearest spot to land. In other words, they reduce exposure.
“Normal” markets are akin to an airplane at cruising altitude. The pilots can likely see many miles in front of them. Expectations for turbulence would be minimal.
Two unexpected “weather fronts” collided in late November/early December. The Omicron variant of the SARS-CoV-2 virus was identified by scientists in South Africa, and the World Health Organization designated it a “variant of concern.” Based on preliminary data this version has more mutations and may be more transmissible.
Next, Fed Chair Powell indicated that inflation pressures were likely to persist well into 2022. As a result, the Fed may reduce their monthly asset purchases more quickly than previously anticipated. They could also start tightening monetary policy (rate hikes) sooner as a result.
Central banks operate like an air traffic control tower. They attempt to manage monetary policy goals that “foster economic conditions that achieve both stable prices and maximum sustainable employment”. In short order, market visibility went from relatively clear skies to significantly overcast.
TREND SEARCH
Here is a look at Google search trend results for “VIX” over the past twelve months with Cboe Volatility Index® (VIX® Index) levels added at relative highs.
VIX Index Google Search Trends (12/6/20 - 12/6/21)
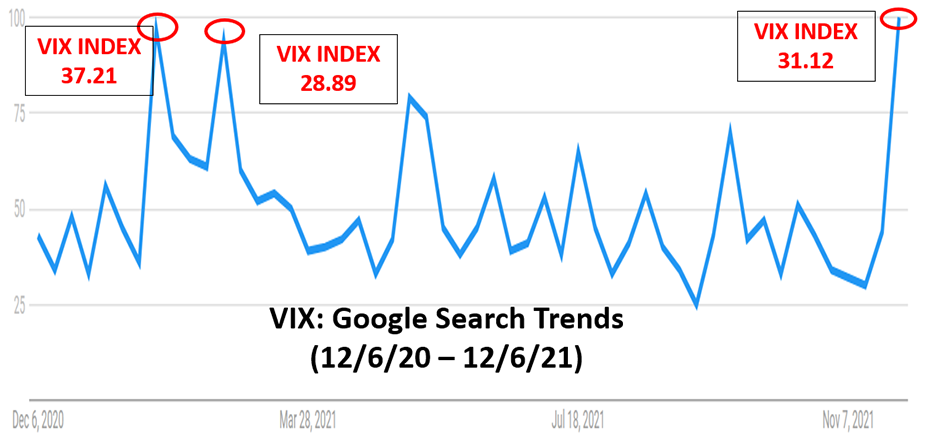
Source: Google & Cboe Global Markets
There appears to be a positive correlation between the direction of the VIX Index and search interest. For example, the two early peaks in Google’s data came the weeks ending January 30 and February 27, 2021. On January 27 the VIX Index closed at 2021 highs (37.21). In late February, the VIX Index moved back up to 28.89. The third peak is recent; in early December, the VIX Index closed at 31.12.
So, what could the VIX Index, and Google search be telling us about the current market environment?
There’s increased attention and desire for understanding when market volatility moves significantly higher. We desire clarity. We want visibility. It’s another example of how visibility and volatility are endemic to the human experience. The ebb and flow of interest in VIX Index is very similar to other trends (market and non-market related). Events capture our attention periodically and then we move on.
To demonstrate further, here’s a five-year history of Google search trends for the S&P 500 Index and VIX Index.
Google Search Trends for S&P 500 Index and VIX Index

Source: Google & Cboe Global Markets
The VIX Index Family
As regular readers know, the VIX Index is based on real-time prices of options on the S&P 500 Index (SPX options) and is designed to reflect investors’ view of future (30-day) expected stock market volatility. The VIX Index is the flagship of Cboe’s volatility franchise, which includes VIX futures and options. The VIX Methodology has been licensed and applied broadly.
Interested in 30-day expected volatility in Apple, Amazon, Google, and Goldman Sachs? They exist: VXAPL, VXAZN, VXGOG, VXGS! Curious what’s going on in crude oil or silver ETF volatility? Check out: OVX and VXSLV. Your focus is on emerging markets? No problem, there’s VXEEM for that.
BAROMETER
The VIX Index, when combined with the futures term structure, could be considered a visibility barometer. As of early December, the average closing level for the VIX Index in 2021 has been 19.64. The VIX futures term structure has traded in contango for most of the year. For our purposes, contango is defined as when the front month VIX futures close at a discount to the second expiry. That’s a historically normal environment (albeit with higher average VIX Index and VIX futures levels).
New to term structure? Check out this week’s Simply Put to learn the basics.

Here’s how the VIX futures term structure closed on November 24 before Omicron was classified as a variant of concern.
VIX Futures Term Structure in Contango (Upward Sloping) 11/24/2021
 Source: Cboe LiveVol
That’s the normal state-of-affairs for VIX futures. The January (month two) futures contract settled at a 2.13 premium compared to the December contract (22.38 – 20.25). The longer dated futures were higher than short-dated contracts. The instrumentation in a cockpit is saying, “things look clear for now”.
Compare that to how the VIX futures closed on December 3. The S&P 500 Index had declined by 3.5% between November 24 and December 3. During five of the previous six sessions the S&P 500 Index moved by more than 1%.
VIX Futures Term Structure in Backwardation (Downward Sloping) 12/3/2021
 Source: Cboe LiveVol
Market participants were confronted with uncertainty surrounding this new form of coronavirus as well as the prospect of tighter monetary policy.
At that point the January futures settled at a 0.35 discount to the December contract. The market was concerned about volatility here and now as indicated by a term structure in backwardation. The longer-dated futures were below near-term contracts.
From a flight standpoint, the aircraft was experiencing significant turbulence. The weather front became front and center. Visibility was far more limited but could be expected to improve in time.
PASSING OR PERSISTENT TURBULENCE
That calls to mind the limited visibility and persistent turbulence that characterized 2020. Last year the average closing level for the VIX Index was 29.25. There were long stretches in 2020 where the near term VIX futures traded at a premium to the next expiry. Generally, that’s not been the case in 2021.
The visual below is an illustration of the largest S&P 500 Index drawdowns since 2020. We’re familiar with the onset of the pandemic. The S&P 500 Index fell nearly 35% in the most violent selloff in the market’s history. The subsequent drawdowns were both less severe and had a shorter duration.
As of December 10, the S&P 500 Index is only fractionally below the all-time closing highs from early November. The rebound in U.S. equities is increasingly rapid, but the next one could be very different.
Duration for S&P 500 Index to Recover to Peak Levels After Pandemic-Related Declines
 Source: New York Times
At present, we know so much more about the virus, and effective vaccines are readily available. That reality lends itself to the price action illustrated in the scatterplot below. Daily returns for the S&P 500 Index have mostly clustered in the green highlighted range between +/-1%. There have only been five sessions where the S&P 500 Index closed more than 2% below the previous settle. Those dates are labeled and highlighted in orange.
S&P 500 Daily Percent Change
 Source: Cboe Global Markets/Options Institute
On average, the S&P 500 Index moves less than 0.7% over the course of a day. When we evaluate the absolute value for daily changes in the broad market this year, the average move comes to 0.61%. How does that figure compare to last year?
The average move for the S&P 500 Index last year (absolute value) was 1.35%. That’s more than double the average move in 2021.
FOG ROLLS IN – HISTORICALLY
From a longer-term perspective, 2021 has not been a particularly volatile year. The chart below plots the number of 1% or more declines (daily) for the S&P 500 Index by year. The colors denote the severity of daily drawdowns with blue signifying between 1% and 2%. The orange corresponds to pullbacks between 2% and 3%. Red shows days with 3% or more selloffs.
Using data from 1990 – 2020, on average the S&P 500 Index has slightly more than twenty-one sessions per year where it declines between 1% and 2%. To date in 2021, there have been fourteen of those days. There are typically six days where the large cap index falls by more than 1%, but less than 3%. Moves of more than 3% are rare except during periods of significant volatility (2020/2009/2008). There were eight days where the S&P 500 Index fell by 3% or more between 2012 and 2019. Last year there were sixteen such occurrences. This year there have been none.
S&P 500 Index Daily (1%) + Sessions
 Source: Cboe Global Markets/Options Institute
FEELINGS
The most recent spat of macro volatility arguably felt worse against the backdrop just described. There’s been a dearth of realized volatility this year. The S&P 500 Index has mostly moved higher with short and shallow pullbacks. Investors typically expect the near future to resemble the past. Omicron and inflation rattled the collective outlook.
In fact, November 26 was the fourth largest single day jump in the VIX Index ever. Turbulence on a flight always feels bad, doesn’t it? As passengers, we prefer to know that the path ahead might be bumpy. Proactive investors and many institutions choose to utilize tools like VIX futures or options and/or SPX overwrites to potentially define their exposure during periods of turbulence.
HARBINIGERS
Elevated measures of bond market forward volatility, covered in the November Inside Volatility, could have been viewed as harbingers of tumult for equity markets.
In capital markets, the evolving relationship between the S&P 500 Index and VIX Index (or futures) may provide signals. For example, in January of 2018 the S&P 500 Index was establishing new highs and was positively correlated to the VIX Index. That’s unusual and could indicate a concerning forecast. Typically, when the S&P 500 Index is moving higher, the VIX Index declines. When two measures move in the same direction, SPX options may be pricing greater future uncertainty.
The flip side can also hold. For example, following the 2016 presidential election the VIX Index and futures started to fall (overnight session) in advance of the S&P 500 futures finding a bottom. That inflection point has become lore for some well-known investors. Famously, Carl Icahn is said to have left a party around midnight when “he saw the markets tanking” and used the opportunity to get long.
Speaking of overnight markets, Cboe Global Markets recently extended their global trading hours for S&P 500 Index (SPX/SPXW) options and VIX options. You may need approval from your brokerage firm, but these two products are now available to trade nearly 24 hours a day, five days a week.
PERSPECTIVE
It can be difficult to maintain perspective in tempestuous markets. Whether it feels like it or not, it’s been a very good year for the S&P 500 Index. The market is up almost 25% YTD (reference 4685). Average calendar year returns going back forty years are ~13%. The largest peak to trough drawdown was only 5.1% (early September to early October). In a “normal” year, the S&P 500 Index falls about 14% from highs at some point.
S&P 500 Index Drawdowns
 Source: Morningstar
It’s also been a blockbuster year for options. According to data from Cboe's Trade Alert, roughly 9.5 billion equity (ETF/Index) options will trade in 2021. That would be a 26% jump from 2020 (7.52B), which was a banner year. The previous high-water mark for volume was 2018 with 5.24B in OCC cleared options. 2021 is on pace to be 81% above that record setting year. It’s absolutely incredible.
TIDBITS
- Total option volume for the week ending 12/3 ~236M contracts. That’s roughly the number of options that traded during calendar year 1993.
- Friday Dec. 3 was the highest VIX Index put option volume (965k) since March 13, 2020 (1M).
- Russell 2000 Index options (RUT) average daily volume in November was 75.1k.
- Highest monthly RUT ADV in three years
- The S&P Case-Shiller US National Home price index is up 19% over the past year.
- Phoenix and Tampa top the list of cities with gains of 33.1% and 27.7% over the last year
- The market capitalization of U.S. financial and nonfinancial equities sits near $68 trillion.
- U.S. GDP is ~$23 trillion, so market cap is roughly 3 times annual GDP
- At the peak in 2000, market cap (financial + nonfinancial equities) was about 1.9 times annual U.S. GDP (Source: Hussman Advisors)
Significant overall exposure can also impact our ability to navigate periods of low visibility. Sticking with our analogy, pilots-in-training don’t begin flying huge aircrafts like an Airbus A380 or Boeing 747. Students of air travel will take early flights in much smaller planes. With that in mind, Nanos by Cboe are an innovative new product with a 1-multiplier and short dated expiries for exposure to the S&P 500 Index. Stay tuned for more in the New Year.
If you like our monthly missive on market volatility, tell a friend to sign up.
Cboe and the Options Institute wishes you a happy, healthy 2022!
Industry News
Events
Volatility411
Get This Newsletter Sent to Your Inbox
Get the Inside Volatility Trading newsletter directly in your inbox by signing up here.
There are important risks associated with transacting in any of the Cboe Company products discussed here. Before engaging in any transactions in those products, it is important for market participants to carefully review the disclosures and disclaimers contained below.
General
- The information provided is for general education and information purposes only. No statement provided should be construed as a recommendation to buy or sell a security, future, financial instrument, investment fund, or other investment product (collectively, a “financial product”), or to provide investment advice.
- In particular, the inclusion of a security or other instrument within an index is not a recommendation to buy, sell, or hold that security or any other instrument, nor should it be considered investment advice.
Options
- Options involve risk and are not suitable for all market participants. Prior to buying or selling an option, a person should review the Characteristics and Risks of Standardized Options (ODD), which is required to be provided to all such persons. Copies of the ODD are available from your broker or from The Options Clearing Corporation, 125 S. Franklin Street, Suite 1200, Chicago, IL 60606.
- Trading FLEX options may not be suitable for all options-qualified market participants. FLEX options strategies only should be considered by those with extensive prior options trading experience.
- Uncovered option writing is suitable only for the knowledgeable market participant who understands the risks, has the financial capacity and willingness to incur potentially substantial losses, and has sufficient liquid assets to meet applicable margin requirements. In this regard, if the value of the underlying instrument moves against an uncovered writer's options position, the writer may incur large losses in that options position and the participant’s broker may require significant additional margin payments. If a market participant does not make those margin payments, the broker may liquidate positions in the market participant’s account with little or no prior notice in accordance with the market participant’s margin agreement.
Futures
- Futures trading is not suitable for all market participants and involves the risk of loss, which can be substantial and can exceed the amount of money deposited for a futures position. You should, therefore, carefully consider whether futures trading is suitable for you in light of your circumstances and financial resources. You should put at risk only funds that you can afford to lose without affecting your lifestyle.
- For additional information regarding the risks associated with trading futures and security futures, see respectively the Risk Disclosure Statement set forth in Appendix A to CFTC Regulation 1.55(c) and the Risk Disclosure Statement for Security Futures Contracts.
VIX® Index and VIX® Index Products
- The Cboe Volatility Index® (known as the VIX Index) is calculated and administered by Cboe Global Indices, LLC. The VIX Index is a financial benchmark designed to be a market estimate of expected volatility of the S&P 500® Index, and is calculated using the midpoint of quotes of certain S&P 500 Index options as further described in the methodology, rules and other information here.
- VIX futures and Mini VIX futures, traded on Cboe Futures Exchange, LLC, and VIX options, traded on Cboe Options Exchange, Inc. (collectively, “VIX® Index Products”), are based on the VIX Index. VIX Index Products are complicated financial products only suitable for sophisticated market participants.
- Transacting in VIX Index Products involves the risk of loss, which can be substantial and can exceed the amount of money deposited for a VIX Index Product position (except when buying options on VIX Index Products, in which case the potential loss is limited to the purchase price of the options).
- Market participants should put at risk only funds that they can afford to lose without affecting their lifestyles.
- Before transacting in VIX Index Products, market participants should fully inform themselves about the VIX Index and the characteristics and risks of VIX Index Products, including those described here. Market participants also should make sure they understand the product specifications for VIX Index Products (VIX futures, Mini VIX futures and VIX options) and the methodologies for calculating the underlying VIX Index and the settlement values for VIX Index Products. Answers to questions frequently asked about VIX Index products and how they are settled is available here.
- Not Buy and Hold Investment: VIX Index Products are not suitable to buy and hold because:
- On their settlement date, VIX Index Products convert into a right to receive or an obligation to pay cash.
- The VIX Index generally tends to revert to or near its long-term average, rather than increase or decrease over the long term.
- Volatility: The VIX Index is subject to greater percentage swings in a short period of time than is typical for stocks or stock indices, including the S&P 500 Index.
- Expected Relationships: Expected relationships with other financial indicators or financial products may not hold. In particular:
- Although the VIX Index generally tends to be negatively correlated with the S&P 500 Index – such that one tends to move upward when the other moves downward and vice versa – that relationship is not always maintained.
- The prices for the nearest expiration of a VIX Index Product generally tend to move in relationship with movements in the VIX Index. However, this relationship may be undercut, depending on, for example, the amount of time to expiration for the VIX Index Product and on supply and demand in the market for that product.
- Mini VIX futures contracts trade separately from regular-sized VIX futures, so the prices and quotations for Mini VIX futures and regular-sized VIX futures may differ because of, for example, possible differences in the liquidity of those markets.
- Final settlement Value: The method for calculating the final settlement value of a VIX Index Product is different from the method for calculating the VIX Index at times other than settlement, so there can be a divergence between the final settlement value of a VIX Index Product and the VIX Index value immediately before or after settlement. (See the SOQ Auction Information section here for additional information.)
Exchange Traded Products (“ETPs”)
- Cboe does not endorse or sell any ETP or other financial product, including those investment products that are or may be based on a Cboe index or methodology or on a non-Cboe index that is based on investment products trading on a Cboe Company exchange (e.g., VIX futures); and Cboe makes no representations regarding the advisability of investing in such products. An investor should consider the investment objectives, risks, charges, and expenses of these products carefully before investing. Investors also should carefully review the information provided in the prospectuses for these products.
- Investments in ETPs involve risk, including the possible loss of principal, and are not appropriate for all investors. Non-traditional ETPs, including leveraged and inverse ETPs, pose additional risks and can result in magnified gains or losses in an investment. Specific risks relating to investment in an ETP are outlined in the fund prospectus and may include concentration risk, correlation risk, counterparty risk, credit risk, market risk, interest rate risk, volatility risk, tracking error risk, among others. Investors should consult with their tax advisors to determine how the profit and loss on any particular investment strategy will be taxed.
Cboe Strategy Benchmark Indices
- Cboe Strategy Benchmark Indices are calculated and administered by Cboe Global Indices, LLC as described in the methodologies, rules and other information available here using information believed to be reliable, including market data from exchanges owned and operated by other Cboe Companies.
- Strategy Benchmark Indices are designed to measure the performance of hypothetical portfolios comprised of one or more derivative instruments and other assets used as collateral. Past performance is not indicative of future results. Strategy Benchmark Indices are not financial products that can be invested in directly, but can be used as the basis for financial products or managing portfolios.
- The actual performance of financial products such as mutual funds or managed accounts can differ significantly from the performance of the underlying index due to execution timing, market disruptions, lack of liquidity, brokerage expenses, transaction costs, tax consequences and other considerations that may not be applicable to the subject index.
Index and Benchmark Values Prior to Launch Date
- Index and benchmark values for the period prior to an index’s launch date are calculated by a theoretical approach involving back-testing historical data in accordance with the methodology in place on the launch date (unless otherwise stated). A limitation of back-testing is that it reflects the theoretical application of the index or benchmark methodology and selection of the index’s constituents in hindsight. Back-testing may not result in performance commensurate with prospective application of a methodology, especially during periods of high economic stress in which adjustments might be made. No back-tested approach can completely account for the impact of decisions that might have been made if calculations were made at the same time as the underlying market conditions occurred. There are numerous factors related to markets that cannot be, and have not been, accounted for in the preparation of back-tested index and benchmark information.
Taxes
- No Cboe Company is an investment adviser or tax advisor, and no representation is made regarding the advisability or tax consequences of investing in, holding or selling any financial product. A decision to invest in, hold or sell any financial product should not be made in reliance on any of the statements or information provided. Market participants are advised to make an investment in, hold or sell any financial product only after carefully considering the associated risks and tax consequences, including information detailed in any offering memorandum or similar document prepared by or on behalf of the issuer of the financial product, with the advice of a qualified professional investment adviser and tax advisor.
- Under section 1256 of the Tax Code, profit and loss on transactions in certain exchange-traded options and futures are entitled to be taxed at a rate equal to 60% long-term and 40% short-term capital gain or loss, provided that the market participants involved and the strategy employed satisfy the criteria of the Tax Code. Market participants should consult with their tax advisors to determine how the profit and loss on any particular option or futures strategy will be taxed. Tax laws and regulations change from time to time and may be subject to varying interpretations.
General
- Past performance of an index or financial product is not indicative of future results.
- Brokerage firms may require customers to post higher margins than any minimum margins specified.
- No data, values or other content contained in this document (including without limitation, index values or information, ratings, credit-related analyses and data, research, valuations, strategies, methodologies and models) or any part thereof may be modified, reverse-engineered, reproduced or distributed in any form or by any means, or stored in a database or retrieval system, without the prior written permission of Cboe.
- Cboe does not guarantee the accuracy, completeness, or timeliness of the information provided. THE CONTENT IS PROVIDED “AS IS” WITHOUT WARRANTY OF ANY KIND, EITHER EXPRESS OR IMPLIED, INCLUDING, WITHOUT LIMITATION, ANY WARRANTY WITH RESPECT MERCHANTABILITY OR FITNESS FOR A PARTICULAR PURPOSE.
- Hypothetical scenarios are provided for illustrative purposes only. The actual performance of financial products can differ significantly from the performance of a hypothetical scenario due to execution timing, market disruptions, lack of liquidity, brokerage expenses, transaction costs, tax consequences and other considerations that may not be applicable to the hypothetical scenario.
- Supporting documentation for statements, comparisons, statistics or other technical data provided is available by contacting Cboe Global Markets at www.cboe.com/Contact.
- The views of any third-party speakers or third-party materials are their own and do not necessarily represent the views of any Cboe Company. That content should not be construed as an endorsement or an indication by Cboe of the value of any non-Cboe financial product or service described.
Trademarks and Intellectual Property
- Cboe®, Cboe Global Markets®, Bats®, BIDS Trading®, BYX®, BZX®, Cboe Options Institute®, Cboe Vest®, Cboe Volatility Index®, CFE®, EDGA®, EDGX®, Hybrid®, LiveVol®, Silexx® and VIX® are registered trademarks, and Cboe Futures ExchangeSM, C2SM, f(t)optionsSM, HanweckSM, and Trade AlertSM are service marks of Cboe Global Markets, Inc. and its subsidiaries. Standard & Poor's®, S&P®, S&P 100®, S&P 500® and SPX® are registered trademarks of Standard & Poor's Financial Services LLC and have been licensed for use by Cboe Exchange, Inc. Dow Jones®, Dow Jones Industrial Average®, DJIA® and Dow Jones Global Indexes® are registered trademarks or service marks of Dow Jones Trademark Holdings, LLC, used under license. Russell, Russell 1000®, Russell 2000®, Russell 3000® and Russell MidCap® names are registered trademarks of Frank Russell Company, used under license. FTSE® and the FTSE indices are trademarks and service marks of FTSE International Limited, used under license. MSCI and the MSCI index names are service marks of MSCI Inc. (“MSCI”) or its affiliates and have been licensed for use by Cboe. All other trademarks and service marks are the property of their respective owners.
Copyright
- © 2021 Cboe Exchange, Inc. All Rights Reserved.


