


Equities Market Research
By Ensi Martini, Business Analyst, U.S. Equities Execution Consulting
The surge in trading activity over the past year has caused significant changes in the trading dynamics of Canada/U.S. interlisted stocks. While recent activity has come down from first-quarter 2021 peaks, the shift in trading activity appears to be lasting. Interlisted stocks facilitate liquidity and investment on both sides of the border but no longer receive relatively equal order flow. Based on Cboe’s Equities Execution Consulting Team’s analysis, the Canada/U.S. share of interlisted volumes has steadily diverged since mid-2020. Let’s find out why.
Our team examined just under 200 interlisted stocks that were primarily listed on Toronto Stock Exchange (TSX). In Canada, these stocks accounted for 17.8% of all Canadian executed volume this year and 53.6% of notional value traded. In the U.S., these names accounted for 4.1% of all U.S. executed volume and 1.7% of notional value traded.
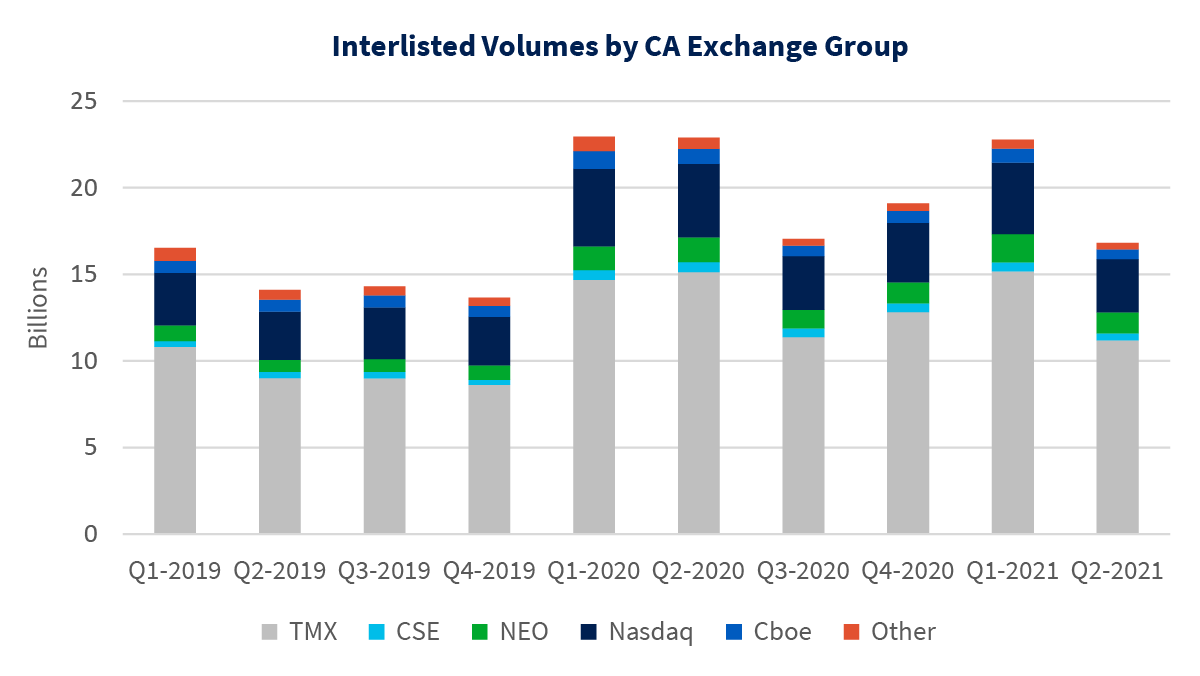
As shown in the chart below, combined interlisted volumes increased 50% between fourth-quarter 2020 and first-quarter 2021, before returning to 2020 levels in second-quarter 2021. Despite record interlisted volumes in first-quarter 2021, the migration to U.S. venues has been apparent and consecutively growing in the four most recent quarters.
Source: Cboe
In the last two years, Canadian venues have had stable interlisted trading volume. Canada interlisted average daily volume (ADV) increased 39% from 2019 to 2020 but fell 9% between 2020 and 2021. Because the dip in between 2020 and 2021 was small relative to growth during the prior year, the decline in Canadian interlisted market share is likely not due to a decrease in Canadian trading.
Source: Cboe
While Canadian volumes appear to be relatively stable over the past year, U.S. interlisted average daily executed volume increased 62% from 2019 to 2020 and 27% from 2020 to 2021. This overall increase in U.S. executed interlisted volume led to a heavier U.S. lean in Canadian/U.S. interlisted trading.
Last year, Cboe’s Execution Consulting team analyzed the growing trend in U.S. off-exchange volumes across all stocks. Focusing on just the interlisted stocks that were analyzed, it is clear that a meaningful increase in U.S. interlisted activity is being driven by increased retail activity represented in off-exchange principal dealer activity. This increase is the primary driver for the divergence across interlisted Canadian/U.S. trading activity.
The breakdown of U.S. exchange group volumes shows that the overall market trend of increased off-exchange trading is also present in interlisted stocks. In first-quarter 2021, Trade Reporting Facilities (TRF) market share was 47% of U.S. interlisted volume, up from approximately 40%. Of the second-quarter 2021 on-exchange interlisted volume, NYSE had the highest market share at 25%, followed by Cboe with 16%.
Source: Cboe
Part of Cboe’s market share can be attributed to the successful rollout of the EDGX® Retail Priority program. Increased retail flow plays a significant role in the shifting market dynamics we observed. Cboe continues to create innovative products that help facilitate best execution for this new order flow.
The chart below further breaks down TRF activity by registered ATSs and principal dealers. ATS interlisted volumes were consistent between first-quarter 2019 and second-quarter 2021. Principal dealer volume increased to 75% of TRF activity in 2020 and to 85% in first-quarter 2021. Principal dealers’ off-exchange executions were 39% of the market in first-quarter 2021 compared to 25% for NYSE and 16% for Cboe.
Source: FINRA
Similar to our previous analysis of the meme stock phenomenon, we examined the number of mentions on social media platforms for interlisted stocks to see if increased mentions led to increased trading in that stock. This was the case with a number of stocks, most notably with Blackberry.
The data indicated a correlation between social media and increased volume for several stocks, but none were more readily apparent than Blackberry (BB). In fact, there is almost a direct correlation between social media mentions and volume.
Source: Cboe, Reddit
Over the past three quarters, this social media-driven activity may have caused BB to increase market share of interlisted trading from 3.3% to 7.9%. TLRY and ACB also stand out as commonly discussed stocks among retail trading-focused social media platforms.
Source: Cboe
Based on our research, the team determined the overall decline in Canadian interlisted market share is not due to a lack of Canadian liquidity, but an increase in overall interlisted activity originating in the U.S. A primary purpose of interlisted stocks is to facilitate increased liqudity between the Canadian and U.S. markets. Therefore, an overall increase in U.S. trading of interlisted stocks, primarily by principal dealers, offers an opportunity for these brokers to tap into the significant liquidity available in Canada through platforms like Cboe’s MATCHNow — the premier conditionals trading venue for large block-size executions at midpoint.
In summary, growth in interlisted trading activity in the U.S. is ultimately beneficial for both U.S. and Canadian market participants. As we work to enable participants to define a sustainable financial future, we will continue to find innovative ways to help North American participants access the growing liquidity available across Cboe’s trading platforms
Please reach out to your Cboe representative to learn more more about the unique functionality and liquidity available in MATCHNow and new services like Cboe LIS powered by BIDS.
2021 Cboe Exchange, Inc. All rights reserved.
The information in this letter is provided for general education and information purposes only. No statement(s) within this letter should be construed as a recommendation to buy or sell a security or to provide investment advice. Supporting documentation for any claims, comparisons, statistics or other technical data in this letter is available by contacting Cboe Global Markets at www.cboe.com/Contact.

