A concise weekly overview of the U.S. equities and derivatives markets
Last week (March 15 to March 19), a tremendous amount of options exposure rolled off the board on Friday, as the March cycle expired and proved to be the largest single-stock expiration ever. Assuming there is no significant sell-off in the end of the first quarter, the S&P 500 Index’s April 2020 - March 2021 run is likely to be the largest 12-month advance since the 1930s. The sharpest and shortest bear market in the history of the S&P 500 ended on March 23, 2020. In the last year, the large-cap index measured as low as 2,200 and recently reached 3,983. Meanwhile, the consensus risk to further potential upside is centered on inflation and interest rates. The Federal Reserve’s focus on unemployment shows a willingness to let the economy “run hot.” Historically, equities don’t hit the brakes until financial conditions tighten.
Quick Bites
Indices
- U.S. Equity Indices were rangebound on the week. COVID-19 vaccination progress, a positive- growth outlook and another stimulus package underpin the overall advance.
- S&P 500 Index (SPX): moved to new all-time highs during the week but ultimately closed lower by 0.7%. The index is up 2.3% month-to-date.
- Nasdaq 100 Index (NDX): Fell by 0.5% for the week. The index is down 0.67% month-to-date.
- Russell 2000 Index (RUT℠): Declined 2.85% for the week, still remaining just off all-time highs. The index is up 3.7% month-to-date.
- Cboe Volatility Index™ (VIX™ Index): Ranged between 18.95 and 23.17 last week, closing below 20 twice. This is the index’s narrowest high-low range since the week ending on February 19.
Options
- SPX options increased slightly week-over-week with an average daily volume (ADV) of about 1.2 million contracts, compared to 1.15 million contracts the previous week. 30-day SPX options implied volatility remains at the very low end of the 1-year range.
- VIX options ADV was about 640,000 contracts last week, up from the previous week’s ADV of approximately 620,000 contracts. VIX options calls and puts traded in roughly equivalent numbers as VIX options volume remains strong in 2021.
- RUT options volume increased week-over-week to an ADV of 44,000 contracts, compared to an ADV of 41,300 contracts the previous week.
Across the Pond
- European and emerging equity markets were little changed on a week-over-week basis.
- The Euro STOXX 50 Index was down 0.8%.
- The MSCI EAFE Index (MXEA™) advanced 0.5% while the MSCI Emerging Markets Index (MXEF™) was down 0.8%.
Charting It Out
Observations on VIX futures term structure and the 10-year U.S. treasury yield
- March VIX futures expired on Wednesday, March 17, and cash settled at 20.20.
- April VIX futures, which are now the front-month contract, declined by 1.95 week-over-week and the May VIX futures contract fell 1.75.
- The current Month-1/Month-2 VIX futures spread is 1.90 wide.
- The front of the VIX futures curve was unusually steep ahead of the March expiry, with an 8-point spread between the expiring contract and the Month-5 (July) futures.
VIX Futures Term Structure
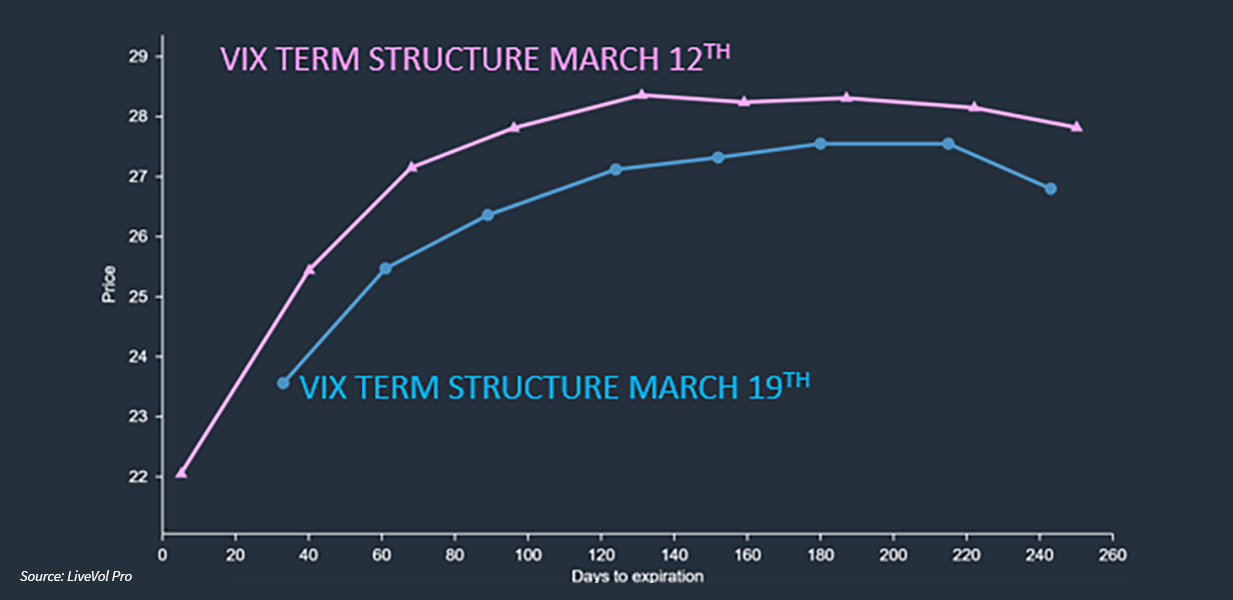
Source: LiveVol Pro
- The U.S. 10-year treasury yield moved between 1.6% and 1.75% last week and the 10-2 treasury spread moved to 1.57%, its widest levels since 2015. The steepest spread over the past 10 years came in early August of 2011 at 2.75%. The first and only U.S. debt downgrade followed shortly after.
U.S. Treasury Bond: 10-Year Minus 2-Year Yield Spread

Source: S&P Dow Jones Indices, Data as of March 17, 2021
Macro Movers
- Big Tech: Leadership was mostly unchanged or slightly lower for the week. Facebook was the outperformer as shares of the social media platform jumped about 8% on the week.
- Banks have performed quite well against the steepening yield curve, though the financials did respond negatively to the Federal Reserve’s refusal to extend the Supplementary Leverage Ratio (SLR) exemption. The decision could push bond prices lower and yields higher if there is diminished demand for government debt on the part of big banks.
- Oil experienced its largest daily decline in six months on Thursday. May WTI crude oil futures traded up to about $68 on March 8 and as low as $58.28 on the March 18, ultimately closing just above $60.
- Bitcoin reached new highs last week as the cash market moved north of $61,000. The weekly lows were around $53,400 but Bitcoin ended the U.S. work week at $58,500.
Coronavirus
- Over the past week there were about 56,000 new COVID-19 cases per day, down from the approximately 57,000 cases per day average seen in the previous week.
- Daily vaccination rates in the U.S. are now averaging approximately 2.46 million, up from 2.2 million the week prior.
- More than 100 million vaccine doses have been administered in the last 60 days.
New COVID-19 Cases in the U.S.

Source: The New York Times
Tidbits from the News
- The chart below illustrates a rolling 5-year correlation between S&P 500 Index annual returns and 10-year U.S. government bonds. Shorter time frames would show far more noise, but generally speaking, if sovereign bond and equity returns are correlated, the theoretical benefits of diversification, such as in a 60/40 portfolio, are diminished.
Long-term U.S. Bond vs. U.S. Equity Correlation

Sources: Bloomberg & IPS Strategic Capital
- Based on the Federal Open Market Committee’s (FOMC) March 17 comments, Fed funds are likely to remain anchored around zero for an extended period of time as the economy recovers. However, the Fed Fund futures market is starting to price in hikes.
Implied Fed Funds Target Rate

Sources: Bloomberg and The Daily Shot
The Week Ahead
- Data to be released: New home sales on Tuesday, Durable good and Purchasing Managers Index (PMI) on Wednesday, Initial Jobless Claims on Thursday and Personal spending on Friday.

Like what you see? Don’t miss the latest insights, webinars, news and announcements from the Cboe Options Institute.
Upcoming Options Institute Webinar
Cash-Secured Put Writing of Index Options | Wednesday, March 24 at 12 p.m. ET
Cboe’s Matt Moran, Head of Index Insights, will be joined by Jonathan Havice, President, Chief Investment Officer and Founder, DGV Solutions, and Eric Metz, President and CIO, SpiderRock Advisors, to discuss the use of cash-secured put writing of index options by money managers, pension funds and other investors.
Register >>>
The information in this article is provided for general education and information purposes only. No statements within this article should be construed as a recommendation to buy or sell a security or futures contract or to provide investment advice. Supporting documentation for any claims, comparisons, statistics or other technical data in this article is available by contacting Cboe Global Markets at www.cboe.com/Contact. Options involve risk and are not suitable for all investors. Prior to buying or selling an option, a person must receive a copy of “Characteristics and Risks of Standardized Options.” Copies are available from your broker or from The Options Clearing Corporation at 125 South Franklin Street, Suite 1200, Chicago, IL 60606 or at www.theocc.com. Cboe Volatility Index and VIX are registered trademarks and of Cboe Exchange, Inc. All other trademarks and service marks are property of their respective owners. © 2021 Cboe Exchange, Inc. All Rights Reserved.


