


Equities Market Research
Off-exchange equities trading volumes continue to grow. Cboe’s Execution Consulting team first explored new trends in the growing off-exchange market before analyzing volume concentration in certain securities on off-exchange venues. In our latest analysis, we’re taking a closer look at execution types available to market participants while U.S. equities volumes are hitting record highs, in part driven by retail participation and a fascination with “meme stocks.”
There are four major types of trading venues available to equity participants:
Exchanges that offer a credit and fee for adding and removing liquidity, respectively, average approximately 50% of on-exchange traded volume. Since these exchanges represent a larger percent of on exchange volume, queue lengths, represented by displayed size, tend to be a bit larger than other public exchanges. As a result, a market participant wanting to trade passively can expect to wait longer in line before receiving an order fill. Nonetheless, the maker/taker markets are a larger pool of liquidity that is accessible to all market participants. Furthermore, participants can choose to display their orders or have their orders remain fully hidden while earning a credit if their orders are executed.
Inverted exchanges, which may charge a fee for adding and apply a credit for removing liquidity, average approximately 5% of the market. Generally, these exchanges have smaller queues; hence providing a market center for market participants who may want to avoid longer queues to receive a faster fill. These exchanges enable passive traders to avoid waiting behind larger orders at maker/taker venues and receive faster fills. Additionally, participants trading on inverted venues have the option to remain fully hidden or have their orders displayed.
Exchanges are heavily regulated and unable to offer participants certain features, including counterparty selection and the greater anonymity and simplicity generally afforded by off-exchange venues, rendering alternative execution venues, or non-displayed market centers, preferable to trading on exchange for certain market participants. The following should provide some additional clarity among the market centers and why a participant may choose to use them.
Alternative Trading Systems (ATSs) serve as an alternative to public markets by providing executions without the use of quoting price or size at or better than the prevailing National Best Bid or Offer (NBBO). ATSs may be used to reduce market impact and gain anonymity. ATSs do not provide public quotes with size, which can make it difficult to model how an order may perform. Many ATSs use segmentation logic that can limit who participants interact with, which primarily decreases adverse selection but can also lead to lower fill rates than those received on public markets. This is because public market quotes are protected, ensuring participants’ orders will get filled in case there is a willing contra-party on any public market. ATSs, on the other hand, do not have the same regulation and orders may go unfilled, even though the market may have traded through the order’s price.
Since the beginning of 2020, off-exchange volume composition has shifted toward principal dealers, according to publicly available FINRA data. However, it is worth noting that not all broker-dealer order flow executed off-exchange is of a principal capacity. On some occasions, two agency orders will be paired away from an ATS through a high-touch trading channel. A 2018 FINRA Regulatory Notice attempted to require firms to disclose Single Dealer Platform (SDP) executions, however it was not adopted.
Unlike an ATS, where a matching engine performs the pairing of orders, an SDP receives an incoming order that may be executed principally upon receipt. Furthermore, SDPs generally execute an order partially or entirely, and the balance is returned to the firm where the order originated. In recent years, SDPs began sending Indications of Interest (IOIs) to clients to potentially improve the fill of an execution. Therefore, similar to an ATS, the execution occurs away from the public market with an immediate print to an eligible Trade Reporting Facility (TRF). Firms may choose to use such platforms to understand the counterparty, to increase the probability of a fill, to receive a fill greater than the displayed liquidity in the public market or because of free commissions.
Wholesale market makers, or principal dealers, are intermediaries or broker-dealers who assist with the handling of retail orders. Such orders can be sent as “held,” which means they must be executed without hesitation at or better than the NBBO. Marketable held orders are reviewed in relation to SEC Rule 605, which was first established in January 2001. Essentially, wholesale market makers provide execution at or better than the NBBO, which may occur anywhere within the spread. Unlike on an exchange, wholesale market makers may execute orders in a principal capacity. Moreover, non-marketable limits received by wholesalers must adhere to Limit Order Display Obligations or Regulation NMS Rule 604 which states that brokers must have reasonably designed procedures to ensure that any held order that is at least 10,000 shares or has a market value of at least $200,000 will be displayed in the public market. Due to these rules, exchanges cannot operate in the same manner as SDPs or wholesalers, reinforcing the importance of market innovation as an attempt to level the playing field.
The ease of execution on off-exchange venues continues to drive off-exchange trading higher. Our team previously demonstrated how market participants are gravitating toward off-exchange trading venues during periods of high volatility, and the data shows that trend has not waned, as illustrated below.
There is plenty of debate about how off-exchange trading has become inaccessible, but that is more correlated to marketable orders. Trading mechanisms like Cboe’s Retail Priority have helped increase access to previously hard-to-reach liquidity by reducing the time to execution for individual investors and the firms that facilitate their orders. However, the connection between high volatility and increases in off-exchange trading is undeniable.
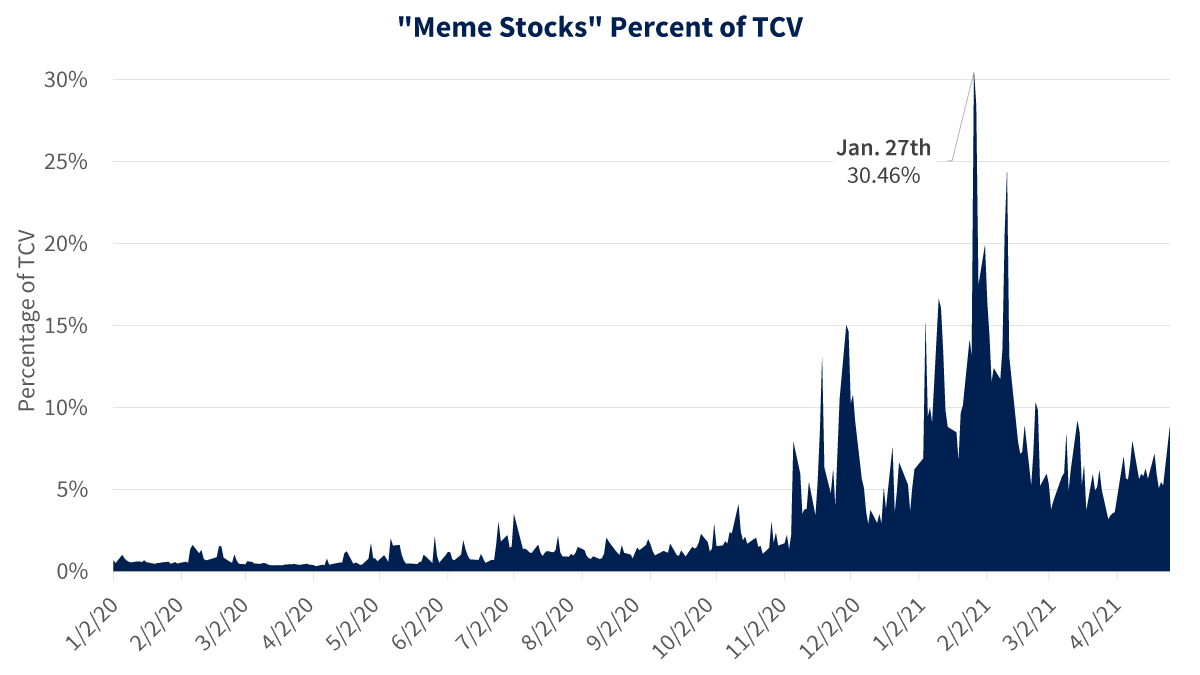
Recently, high volume off-exchange trading has been associated with stocks popular on social media, also known as “meme stocks.” To understand the new phenomenon, Cboe’s Execution Consulting Team analyzed 10 stocks commonly referred to as “meme stocks” whose high volumes are primarily driven by retail sentiment. The team analyzed: Sundial Growers (SNDL), AMC Entertainment (AMC), Naked Brand Group (NAKD), BlackBerry (BB), GameStop (GME), Nokia (NOK), Zomedica (ZOM), Castor Meritime (CTRM), Express, Inc. (EXPR) and Koss Corporation (KOSS).
These 10 stocks have comprised more than a quarter of trading in the market over the past few months. During the peak of the “meme stock” phenomenon on January 27, these 10 symbols accounted for over 30% of the entire market’s volume, although most of the volume occurred on off-exchange venues. For example, in March 2021, 59% of the trades in these 10 stocks occurred off-exchange, which is about 17% more than in March 2020. This trend continued in April 2021, with off-exchange market share in these 10 retail-driven symbols increasing about 7%. Though most of the volume in these stocks is traded off-exchange, market participants can still trade these stocks at on-exchange venues. Cboe Global Markets’ exchanges – primarily its EDGX® Equities Exchange – captured more market share for these 10 stocks than any of its exchange competitors.
Time-to-fill is a critical metric to consider when deciding where to post orders. We calculated the intermarket queue position for the 10 “meme stocks” by ranking each exchange group by the average time it takes to fill orders in these 10 stocks. Prior to extreme volatility in these stocks in January, Cboe® and Nasdaq competed closely for the top intermarket queue position, but more recently, Cboe has ranked highest in average intermarket queue position for all 10 stocks. As illustrated below, these stocks accounted for more than 14% of the market in January 2021. A volume spike in these stocks was closely associated with an increase in the intermarket queue ranking on Cboe’s exchanges, and since February 2021, Cboe’s exchanges have outpaced their peers in time-to-fill in popular retail stocks.
In March, trading volumes in “meme stocks” dropped closer to 2020 volumes. With the decrease of retail trading participation, securities priced at less than $1 also saw a massive decrease in overall volume week-over-week. Sub-dollar securities made up about 2-3% of total composite volume (TCV), which is closer to the volumes seen before the market volatility experienced at the beginning of 2021. However, at the start of April, volume began to climb back to early 2021 levels. By the week of April 25, volume in sub-dollar securities comprised about 8.4% of the total market.
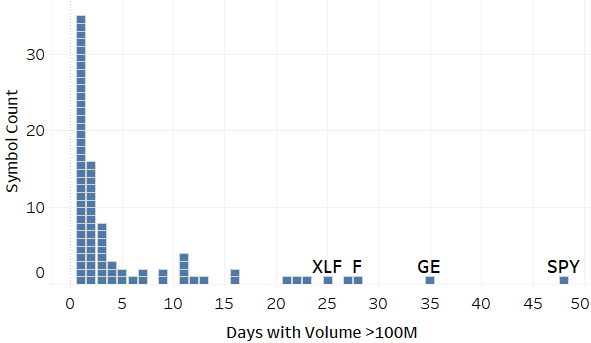
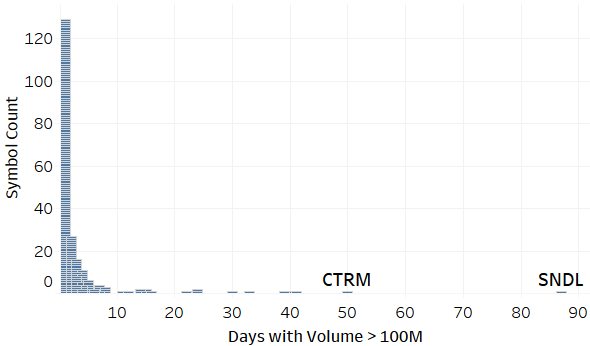
This is one of the biggest shifts in market volume in some time. To study this trend, we compared January 1, 2020 - May 7, 2020 to the same time range in 2021, which encompassed 88 and 87 trading days, respectively. While volume in 2021 is flooded with “meme stocks,” there are also certain stocks that have seen much higher trading volume in 2021 than they did in 2020. The histograms below detail the number of days volume in any stock is greater than 100 million and highlights a few substantial differences between 2020 and 2021.
In 2020, 35 distinct stocks reached a volume of 100 million shares for only one day during the year. During the same timeframe in 2021, 129 stocks reached a volume of 100 million shares on only one day. There was also a shift in the composition of the types of stocks trading higher volumes. In 2020, some of the most liquid stocks were the SPDR S&P 500 Trust ETF (ticker: SPY) and General Electric (ticker: GE), with volumes greater than 100 million shares on 48 and 35 days, respectively, in 2020. In 2021, SPY and GE have only had 22 and 15 days of the same magnitude, respectively. Meanwhile, Sundial Growers (ticker: SNDL) had volumes greater than 100 million shares on all 87 trading days studied in 2021, highlighting the tremendous outlier market activity happening.
January 1, 2020 - May 7, 2020
January 1, 2021 - May 7, 2021
On any given day, we have observed outsized volumes in low-priced symbols, which Cboe defines as stocks below $5. Frequently, low-priced securities experience very short-lived, even one day, spikes in volume before reverting to their original, low average daily volume (ADV) levels. These short-lived volume increases are correlated with the concentration of executed volume at a few market centers for April and prior months.
As the aforementioned highlights, different market centers provide different functions and/or features that a market participant may evaluate when using such platforms. As we have written in the past, exchanges have different regulatory requirements than non-exchange venues, including when attempting to adopt new features, and there are ways that these differences could be changed to foster healthy competition and create a more level playing field. In the meantime, we will continue developing new trading mechanisms that help on-exchange trading participants achieve their goals. As equity volumes continue to reach record highs, access to quality liquidity is a key component to better trade execution. The Cboe North American Equities team is focused on innovation that will continue working to enhance your trading execution and improve your experience. Please reach out to our coverage team with questions and to learn how we can help you optimize your trading experience.
1 Lower magnitude indicates better rank
1 Source: FINRA ATS Data (https://otctransparency.finra.org/otctransparency/AtsDownload)
2, 3, 5, 6, 7 Source: Cboe Market Data
4 Source: Theyses/Maystreet Market Data
2021 Cboe Exchange, Inc. All rights reserved.
The information in this letter is provided for general education and information purposes only. No statement(s) within this letter should be construed as a recommendation to buy or sell a security or to provide investment advice. Supporting documentation for any claims, comparisons, statistics or other technical data in this letter is available by contacting Cboe Global Markets at www.cboe.com/Contact.

