


Data Analytics and Indices
Listed option volume surged in 2021 to record levels as U.S. stock markets repeatedly touched all-time highs, with the S&P 500 Index finishing the year up 26.9% and Nasdaq Composite up 21.4%. Daily total option volume records were set 17 times during the year, including ten days over 50M contracts. Overall, 9.87 billion contracts traded over 252 sessions; 32% above the 2020 record 7.47 billion contracts and more than double the 2019 total 9.8 billion.
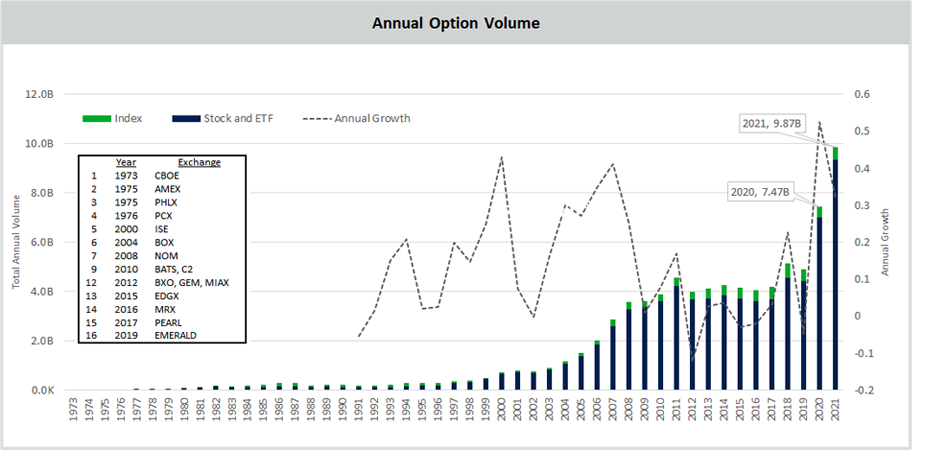
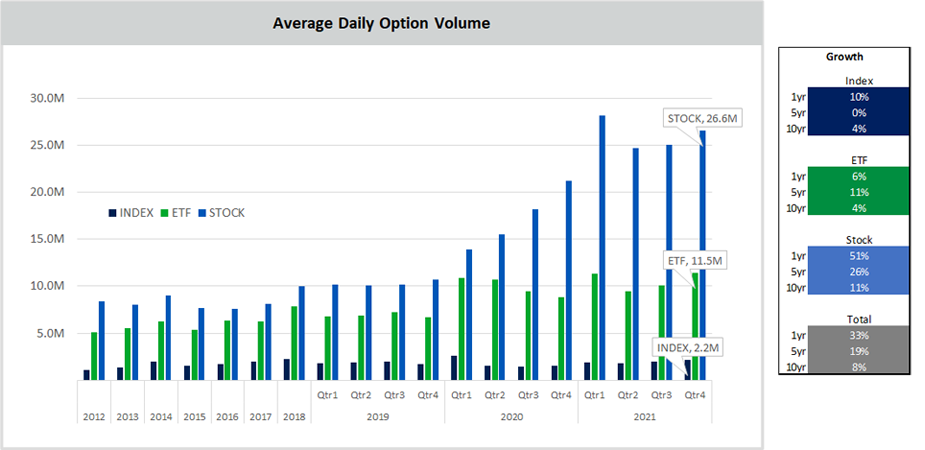
Across product types, Index and ETF options saw moderate growth of 10% and 6% respectively, while single stock options flow jumped more than 50%, building on the remarkable increase seen in 2020 when single stock option trading jumped 68%. Drivers for the surge include increasing adoption by retail traders on zero or low-commission brokerage accounts, low interest rates, extended work-from-home dynamics and increased media focus on meme stocks.
Notably, the 51% increase in single stock option volume greatly exceeds the volume increase in shares underlying those stocks for the year, which was approximately 5.2%. As a ratio of options notional shares to actual underlying shares, U.S. options flow increased from 23% to 33% as new participants entered and existing participants increased their levels of activity. This relative increase in option activity resulted in the notional dollar value of total shares underlying the options exceeding the actual share value transacted for the first time since options were listed.

Examination of activity by size that smaller executions continue to grow in frequency, with trades below 10 contracts approaching a high of 6 million contracts per day in November 2021, nearly double the level of small size activity executed prior to 2020. Large trades, 1000 contracts and up, saw relatively little growth over the year, suggesting large block trades may be executing in smaller lots or moving off-floor to trade over the counter, with dealers hedging algorithmically to minimize impact and visibility.

At the smallest possible trade size, 1 contract, total activity in 2021 exceeded 2020, with a recent share near 7% of the daily volume, or approximately 3 million contracts per day. Current levels of 1-lot flow are nearly 6x the average seen five years ago, and include a mix of retail, ‘pro-tail’, and institutional traders using algorithms to minimize market impact and optimize trading costs.

While single stock and ETF options receive much of the retail focus, a similar pattern in 1-lot trades in SPX Index options suggests growing use by retail and/or smaller accounts.

Data published by some brokers can be used to estimate options market share for a number of leading firms. Leading the list since mid-2020 is Robinhood with nearly 12% adv, or 4 to 5M contracts daily in 2021. Robinhood began offering no-commission options trading in Dec 2017, and recently reported a funded account base near 20M clients. We estimate approximately 1 to 2M of these accounts trade options.

A closer look at put and call volume over the past few years shows a heavy focus on call options as the S&P 500 has climbed nearly 47% from March 2020 lows. In 2021 the non-index put/call volume ratio dipped to historic lows near .55, or 9 calls for every 5 puts compared to an average close to 0.9 from 2010 thru 2019. By contrast, index products saw the ratio of puts to calls lift from approximately 1.2 to 1.5 over the same period, underscoring the disparate use cases of each product type.

Short-dated ‘weekly’ options have grown in popularity since they were first offered a decade ago and subsequently expanded to include most liquid products. For many of the most active symbols, such as AAPL and TSLA, weeklys often make up nearly 60% of daily volume. Market wide, contracts expiring within 5 days of trade date made up 46% of the flow, nearly double the market share seen in 2017.

Volume by duration shows a steady rise in market share of contracts expiring within ten days of execution, with total approaching 50% in late 2021, nearly double the level when weeklys were introduced.

In terms of market share, short-term contracts continue to see strong growth, with contracts expiring with one day making up 21% of the 2021 flow, compared with 16% in 2020.

Recent market dynamics appear to be having an impact in option pricing, particularly among ‘meme’ stocks popular with a segment of retail traders. Since the first quarter of 2020, the frequency of stocks with ‘inverted put/call skew,’ has increased by nearly 300%. This condition occurs when equilibrium prices of out-of-the-money call options are higher than similar OTM (out-the-money) put options, contrary to the typical volatility ‘smile’ or ‘skew’ in which puts trade at higher implied volatility levels to reflect expectations of downside risk exceeding that of similar upside moves.

One factor leading to greater option volume in 2021 is the dramatic increase in underlying issues with listed options, which had been declining in recent years with the number of publicly listed companies. After dipping to a multiyear low of 4270 symbols in 2020, a steady supply of newly listed underlying securities, including a surge in actively managed ETFs and SPACs (special purpose acquisition company), created more than 1000 new option listings in 2021, peaking at a record 5600 products available to traders by the end of the year. One consequence of the increase in listings, combined with weekly expirations and significant price volatility has been an unprecedented number of individual contracts listed, near 1.6M in November.

Data published by the Options Clearing Corp (OCC) identifies total option volume by account-type for all products, with total firm volume relatively stable near 5M contracts per day as customer and market-maker activity increased. Drivers for this shift include the business model of many retail brokers, which direct orders to market-makers for potential price improvement. In addition, the continued adoption of algorithms by institutional customers leads to lower levels of firm volume in the form of capital commitment, boosting market maker share.

Industry market structure was unchanged this year, with five exchange operators running a combined 16 exchanges, providing participants a choice of traditional, maker-taker, and alternate fee models as well a broad range of order types, complex order books, and other differentiators.

At the individual exchange level, market dynamics feature robust competition, with all 16 exchanges trading significant market share. The relative increase in multi-listed single stock and ETF option flow versus proprietary index activity is evident in the compressed share traded on the dominant index exchange, Cboe®. Typically, periods of higher volatility or market disruptions boost activity in ETF and Index products, which was seen in mid-December 2021, and January 2022 when Cboe Volatility Index® (VIX® Index) nearly doubled to the 30 range.

At the exchange operator level, market share increased for the smaller operators, BOX, MIAMI, and ICE, while the largest two operators, Cboe and Nasdaq, saw modest declines in market share over 2021.

Overall breadth of option trading increased in 2021 with 69% of the total volume trading in the top 100 listings, a change from 2020 when the top 100 was 73% of the flow and a significant widening from 2018 when 77% of the volume was top 100. The top 20 ‘hyperliquid’ symbols made up 42% of 2021 volume, compared to 47% in 2020.

Another measure of breadth involves examination of listings by average daily volume bracket. In early 2019, symbols trading fewer than 200 contracts per day made up nearly 65% of the listings, with untraded symbols amounting to nearly 8%. In early 2021, as single-stock option activity spiked in conjunction with a number of high-profile meme stocks, the share of 200 contract adv and below dropped as lows as 45%. By late 2021 these listings were nearly 60% of the total.

Complex orders, including spreads and trades tied to underlying hedges, remain a large part of the trading ecosystem, historically averaging near 70% of index and 30% of non-index volume. Complex share typically dips during periods of higher volatility when directional trades pick up compared to systematic strategies. Over the past two years the influx of newer participants appears to be further dampening complex share, with recent levels near 65% in indexes and 25% for ETF and single stock options.

Looking forward, many of the dynamics behind the 2021 option activity surge are likely to continue into the New Year, with January 2022 delivering two new daily volume records near 62M contracts, and daily average volume near 43.7M contracts, implying growth of 13%, to 11 billion contracts annually. As the US listed options markets approach their 50th birthday, recent activity shows that robust competition, unprecedented efficiency, and a diverse mix of participants are finding value in the offerings available. In addition, innovations such as the 1-multiplier Cboe Nanos index options, slated to launch in March, additional Tuesday/Thursday expirations, expanded trading hours for Cboe Index options, and other industry initiatives will continue to emerge, driven by market dynamics and meeting the needs of the financial community for years to come.

There are important risks associated with transacting in any of the Cboe Company products discussed here. Before engaging in any transactions in those products, it is important for market participants to carefully review the disclosures and disclaimers below.
General
The information provided is for general education and information purposes only. No statement provided should be construed as a recommendation to buy or sell a security, future, financial instrument, investment fund, or other investment product (collectively, a “financial product”), or to provide investment advice.
In particular, the inclusion of a security or other instrument within an index is not a recommendation to buy, sell, or hold that security or any other instrument, nor should it be considered investment advice.
Options
Options involve risk and are not suitable for all market participants. Prior to buying or selling an option, a person should review the Characteristics and Risks of Standardized Options (ODD) , which is required to be provided to all such persons. Copies of the ODD are available from your broker or from The Options Clearing Corporation, 125 S. Franklin Street, Suite 1200, Chicago, IL 60606.
Trading FLEX options may not be suitable for all options-qualified market participants. FLEX options strategies only should be considered by those with extensive prior options trading experience.
Uncovered option writing is suitable only for the knowledgeable market participant who understands the risks, has the financial capacity and willingness to incur potentially substantial losses, and has sufficient liquid assets to meet applicable margin requirements. In this regard, if the value of the underlying instrument moves against an uncovered writer's options position, the writer may incur large losses in that options position and the participant’s broker may require significant additional margin payments. If a market participant does not make those margin payments, the broker may liquidate positions in the market participant’s account with little or no prior notice in accordance with the market participant’s margin agreement.
Futures
Futures trading is not suitable for all market participants and involves the risk of loss, which can be substantial and can exceed the amount of money deposited for a futures position. You should, therefore, carefully consider whether futures trading is suitable for you in light of your circumstances and financial resources. You should put at risk only funds that you can afford to lose without affecting your lifestyle.
For additional information regarding the risks associated with trading futures and security futures, see respectively the Risk Disclosure Statement set forth in Appendix A to CFTC Regulation 1.55(c) and the Risk Disclosure Statement for Security Futures Contracts.
VIX® Index and VIX® Index Products
The Cboe Volatility Index® (known as the VIX Index) is calculated and administered by Cboe Global Indices, LLC. The VIX Index is a financial benchmark designed to be a market estimate of expected volatility of the S&P 500® Index, and is calculated using the midpoint of quotes of certain S&P 500 Index options as further described in the methodology, rules and other information here .
VIX futures and Mini VIX futures, traded on Cboe Futures Exchange, LLC, and VIX options, traded on Cboe Options Exchange, Inc. (collectively, “VIX® Index Products”), are based on the VIX Index. VIX Index Products are complicated financial products only suitable for sophisticated market participants.
Transacting in VIX Index Products involves the risk of loss, which can be substantial and can exceed the amount of money deposited for a VIX Index Product position (except when buying options on VIX Index Products, in which case the potential loss is limited to the purchase price of the options).
Market participants should put at risk only funds that they can afford to lose without affecting their lifestyles.
Before transacting in VIX Index Products, market participants should fully inform themselves about the VIX Index and the characteristics and risks of VIX Index Products, including those described here. Market participants also should make sure they understand the product specifications for VIX Index Products ( VIX futures , Mini VIX futures and VIX options ) and the methodologies for calculating the underlying VIX Index and the settlement values for VIX Index Products. Answers to questions frequently asked about VIX Index products and how they are settled is available here .
Not Buy and Hold Investment: VIX Index Products are not suitable to buy and hold because:
Volatility: The VIX Index is subject to greater percentage swings in a short period of time than is typical for stocks or stock indices, including the S&P 500 Index.
Expected Relationships: Expected relationships with other financial indicators or financial products may not hold. In particular:
Final settlement Value: The method for calculating the final settlement value of a VIX Index Product is different from the method for calculating the VIX Index at times other than settlement, so there can be a divergence between the final settlement value of a VIX Index Product and the VIX Index value immediately before or after settlement. (See the SOQ Auction Information section here for additional information.)
Exchange Traded Products ("ETPs")
Cboe does not endorse or sell any ETP or other financial product, including those investment products that are or may be based on a Cboe index or methodology or on a non-Cboe index that is based on investment products trading on a Cboe Company exchange (e.g., VIX futures); and Cboe makes no representations regarding the advisability of investing in such products. An investor should consider the investment objectives, risks, charges, and expenses of these products carefully before investing. Investors also should carefully review the information provided in the prospectuses for these products.
Investments in ETPs involve risk, including the possible loss of principal, and are not appropriate for all investors. Non-traditional ETPs, including leveraged and inverse ETPs, pose additional risks and can result in magnified gains or losses in an investment. Specific risks relating to investment in an ETP are outlined in the fund prospectus and may include concentration risk, correlation risk, counterparty risk, credit risk, market risk, interest rate risk, volatility risk, tracking error risk, among others. Investors should consult with their tax advisors to determine how the profit and loss on any particular investment strategy will be taxed.
Cboe Strategy Benchmark Indices
Cboe Strategy Benchmark Indices are calculated and administered by Cboe Global Indices, LLC as described in the methodologies, rules and other information available here using information believed to be reliable, including market data from exchanges owned and operated by other Cboe Companies.
Strategy Benchmark Indices are designed to measure the performance of hypothetical portfolios comprised of one or more derivative instruments and other assets used as collateral. Past performance is not indicative of future results. Strategy Benchmark Indices are not financial products that can be invested in directly, but can be used as the basis for financial products or managing portfolios.
The actual performance of financial products such as mutual funds or managed accounts can differ significantly from the performance of the underlying index due to execution timing, market disruptions, lack of liquidity, brokerage expenses, transaction costs, tax consequences and other considerations that may not be applicable to the subject index. Index and Benchmark Values Prior to Launch Date
Index and benchmark values for the period prior to an index’s launch date are calculated by a theoretical approach involving back-testing historical data in accordance with the methodology in place on the launch date (unless otherwise stated). A limitation of back-testing is that it reflects the theoretical application of the index or benchmark methodology and selection of the index’s constituents in hindsight. Back-testing may not result in performance commensurate with prospective application of a methodology, especially during periods of high economic stress in which adjustments might be made. No back-tested approach can completely account for the impact of decisions that might have been made if calculations were made at the same time as the underlying market conditions occurred. There are numerous factors related to markets that cannot be, and have not been, accounted for in the preparation of back-tested index and benchmark information.
Taxes
No Cboe Company is an investment adviser or tax advisor, and no representation is made regarding the advisability or tax consequences of investing in, holding or selling any financial product. A decision to invest in, hold or sell any financial product should not be made in reliance on any of the statements or information provided. Market participants are advised to make an investment in, hold or sell any financial product only after carefully considering the associated risks and tax consequences, including information detailed in any offering memorandum or similar document prepared by or on behalf of the issuer of the financial product, with the advice of a qualified professional investment adviser and tax advisor.
Under section 1256 of the Tax Code, profit and loss on transactions in certain exchange-traded options and futures are entitled to be taxed at a rate equal to 60% long-term and 40% short-term capital gain or loss, provided that the market participants involved and the strategy employed satisfy the criteria of the Tax Code. Market participants should consult with their tax advisors to determine how the profit and loss on any particular option or futures strategy will be taxed. Tax laws and regulations change from time to time and may be subject to varying interpretations.
General
Past performance of an index or financial product is not indicative of future results.
Brokerage firms may require customers to post higher margins than any minimum margins specified.
No data, values or other content contained in this document (including without limitation, index values or information, ratings, credit-related analyses and data, research, valuations, strategies, methodologies and models) or any part thereof may be modified, reverse-engineered, reproduced or distributed in any form or by any means, or stored in a database or retrieval system, without the prior written permission of Cboe.
Cboe does not guarantee the accuracy, completeness, or timeliness of the information provided. THE CONTENT IS PROVIDED “AS IS” WITHOUT WARRANTY OF ANY KIND, EITHER EXPRESS OR IMPLIED, INCLUDING, WITHOUT LIMITATION, ANY WARRANTY WITH RESPECT MERCHANTABILITY OR FITNESS FOR A PARTICULAR PURPOSE.
Hypothetical scenarios are provided for illustrative purposes only. The actual performance of financial products can differ significantly from the performance of a hypothetical scenario due to execution timing, market disruptions, lack of liquidity, brokerage expenses, transaction costs, tax consequences and other considerations that may not be applicable to the hypothetical scenario.
Supporting documentation for statements, comparisons, statistics or other technical data provided is available by contacting Cboe at www.cboe.com/Contact .
The views of any third-party speakers or third-party materials are their own and do not necessarily represent the views of any Cboe Company. That content should not be construed as an endorsement or an indication by Cboe of the value of any non-Cboe financial product or service described.
The inclusion of research not conducted or explicitly endorsed by Cboe should not be construed as an endorsement or indication of the value of that research.
Trademarks and Intellectual Property
Cboe®, Cboe Global Markets®, Bats®, BIDS Trading®, BYX®, BZX®, Cboe Options Institute®, Cboe Vest®, Cboe Volatility Index®, CFE®, EDGA®, EDGX®, Hybrid®, LiveVol®, Silexx® and VIX® are registered trademarks, and Cboe Futures ExchangeSM, C2SM, f(t)optionsSM, HanweckSM, and Trade AlertSM are service marks of Cboe Global Markets, Inc. and its subsidiaries. Standard & Poor's®, S&P®, S&P 100®, S&P 500® and SPX® are registered trademarks of Standard & Poor's Financial Services LLC and have been licensed for use by Cboe Exchange, Inc. Dow Jones®, Dow Jones Industrial Average®, DJIA® and Dow Jones Global Indexes® are registered trademarks or service marks of Dow Jones Trademark Holdings, LLC, used under license. Russell, Russell 1000®, Russell 2000®, Russell 3000® and Russell MidCap® names are registered trademarks of Frank Russell Company, used under license. FTSE® and the FTSE indices are trademarks and service marks of FTSE International Limited, used under license. MSCI and the MSCI index names are service marks of MSCI Inc. (“MSCI”) or its affiliates and have been licensed for use by Cboe. All other trademarks and service marks are the property of their respective owners.
Copyright
© 2022 Cboe Exchange, Inc. All Rights Reserved.

