By Matt Moran, Director, Institutional Product Advancement
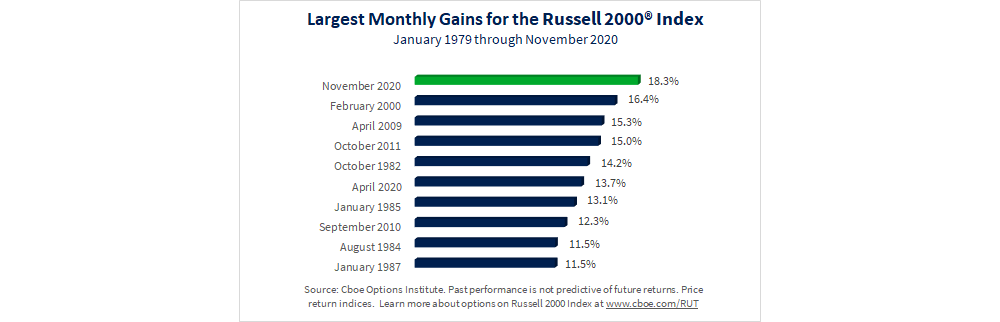
The Russell 2000® Index (RUTSM) had its largest ever monthly percentage gain in November 2020, rising 18.3%. The index performed so well it out-performed several other indices, as noted in a recent edition of Inside Volatility Trading. So, what caused this dramatic increase?
Promising News Leads to Positive Reaction
The Russell 2000 Index measures the performance of the small-cap segment of the U.S. equity market. Overall, small-cap stocks tend to be more cyclical and more volatile than large-cap stocks, as well as more sensitive to improvements in the economic cycle. Toward the end of November, the Russell 2000 Index reacted positively to promising news about the efficacy of potential COVID-19 vaccines. In addition to ending the pandemic, the news signified a potential boost to sectors of the market that are more sensitive to the economic recovery, such as travel, energy, retail and industrials.
The chart below shows the 10 months with the largest percentage gains for the index over its almost 42-year price history. As you can see, the November 2020 record was the largest monthly gain in more than 20 years.
Seasonality and Strong Returns in Novembers and Decembers
In early November, Cboe hosted a webinar about harnessing small-cap volatility with Russell 2000 Index options. During the webinar, the panelists noted that decades ago some analysts cited a “January Effect,” with strong performance for small-cap stocks in January. However, in recent decades the Russell 2000 Index has often had strong performances in November and December.
This relatively recent switch is depicted in the charts below, which were also shared during the webinar.


What the Research Says
Wilshire Analytics’ recently published research paper, The Cboe Russell 2000 Option Benchmark Suite - Improving Diversification by Harvesting Volatility Risk Premiums, analyzes the performance of four Cboe indices: Cboe Russell 2000 BuyWrite Index (BXRSM), Cboe Russell 2000 30-Delta BuyWrite Index (BXRDSM), Cboe Russell 2000 PutWrite Index (PUTRSM), and Cboe Russell 2000 Zero-Cost Put Spread Collar Index (CLLRSM). The research highlights several key features of the four indices.
- Expanded Efficient Frontier. A 15% additional allocation of a Cboe PUTR Index to stock and bond portfolios improved returns by 8 basis points and reduced standard deviation by 21 basis points, to 57 basis points (Exhibit 1).
- Improved Tail Risk and Lower Volatility. All four Cboe indices had lower volatility and maximum drawdowns, as compared to the Russell 2000 Index. Most notably, the PUTR Index had a 29% lower standard deviation and 28% less severe drawdown than the Russell 2000 Index (Exhibit 2).
- Richly Priced Options Premiums Harvested. All four Cboe indices sold RUT options and collected monthly premiums. The BXR Index collected an average gross premium of 2.1%. RUT options were usually richly priced, as average implied volatility exceeded average realized volatility by about 3.3 points (Exhibits 9 & 10).
- Enhanced Risk-Adjusted Returns. The implied volatility risk premium fueled strong risk-adjusted returns for the PUTR Index, which demonstrated a 28% higher Sharpe Ratio than the Russell 2000 Index (Exhibit 4).
Quick Facts About Stock Indices
During the webinar, Catherine Yoshimoto, Director, Product Management at FTSE Russell shared several key points about the Russell 1000 and Russell 2000 indices, including:
- The Russell 2000 Index added 30 IPOs in the third quarter of 2020;
- Volatility for the Russell 2000 Index has been higher than for the Russell 1000;
- Volatility for the Russell 2000 is currently higher than for the FTSE Global ex-U.S. Small-Cap Index;
- Factor performance provides a partial explanation as to why the U.S. small-cap and large-cap indices have performed differently. The percentage of non-U.S. revenue was about 16.9% for the Russell 2000 Index and 37.6% for the Russell 1000 Index.
Learn More
Related Cboe indices:
- Cboe Russell 2000 One-Week PutWrite Index (WPTRSM) tracks the value of a hypothetical portfolio of securities (WPTR portfolio) that yields a buffered exposure to Russell 2000® stock returns. The WPTR portfolio is composed of Treasury bills and of a position in a one-week at-the-money put option on the Russell 2000 index (RUT put). The index collects options premiums 52 times a year.
- Cboe Russell 2000 Volatility Index (RVXSM) is a VIX®-style estimate of the expected 30-day volatility of Russell 2000® Index returns. RVX is calculated by interpolating between two weighted sums of option midquote values, in this case options on the Russell 2000 Index (RUT) The two sums essentially represent the expected variance of the Russell 2000 Index returns up to two option expiration dates that bracket a 30-day period of time. Historically, volatility of the RVX Index is usually higher than the VIX Index.
- Target Outcome Indices introduced in November 2020: Cboe Russell 2000 Enhanced Growth Index Balanced Series (RPENSM and the Cboe Russell 2000 Buffer Protect Index Balanced Series (RPROSM). Target Outcome Indices are options-based strategy benchmarks designed to provide targeted returns relative to a referenced U.S. domestic stock market index, and in the case of buffer protect strategies, to limit downside risk.
To learn more about tools that can help with hedging, income enhancement, and adjusting your exposure to small-cap and large-cap stocks, click here.
The Cboe Options Institute offers webinars, teach-ins and more to help you learn about derivatives and the finance industry. Visit our website for more information.


