


Data Analytics and Indices
Highlights:
The launch of two new Cboe-MSCI indices and three new index options products fills the need for more tools to track and manage global equity exposure.
Two New Volatility Indices:
Three New Index Options: Cboe is expanding its existing MSCI Index options suite by introducing three new products based on MSCI global indices:
The new index options join the current suite of Cboe MSCI tradable products, which includes the Cboe MSCI EAFE Index Options (MXEASM) and Cboe MSCI Emerging Markets Index Options (MXEFSM).
The table below compares five key MSCI stock indices.

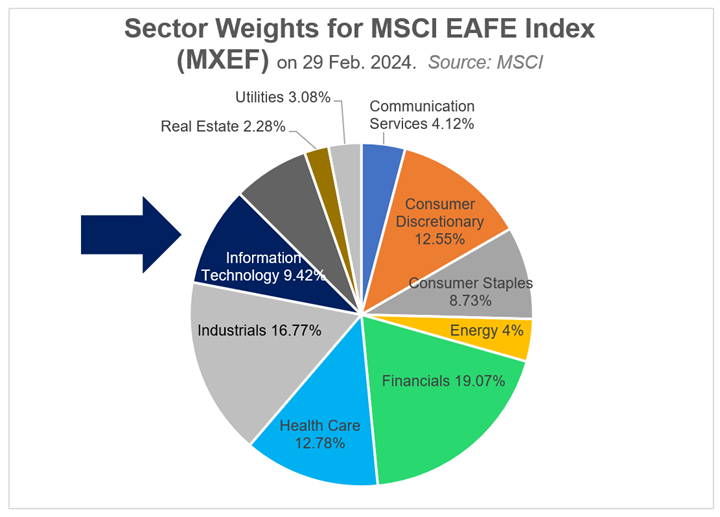
Differences in sector weighting among the MSCI stock indices have led to differences in performance among the five indices. For example, at the end of February 2024 the weighting of the Information Technology sector was higher in the MSCI USA Index (30.13%) than in the other four indices, with MSCI World Index having the second highest weighting (24.11%), followed by MSCI ACWI Index (23.96%), MSCI Emerging Markets Index (22.76%), and MSCI EAFE Index (9.42%).
In 2023 the average return of the so-called “Magnificent Seven” U.S. meg-cap stocks (AAPL, GOOGL, MSFT, AMZN, META, TSLA, and NVDA) was 111%. As a tech-heavy index, the MSCI USA Index returned 27.1% in 2023 and outgained the other four MSCI indices in five of the past six calendar years. See the Annual Returns heat map below for more data.
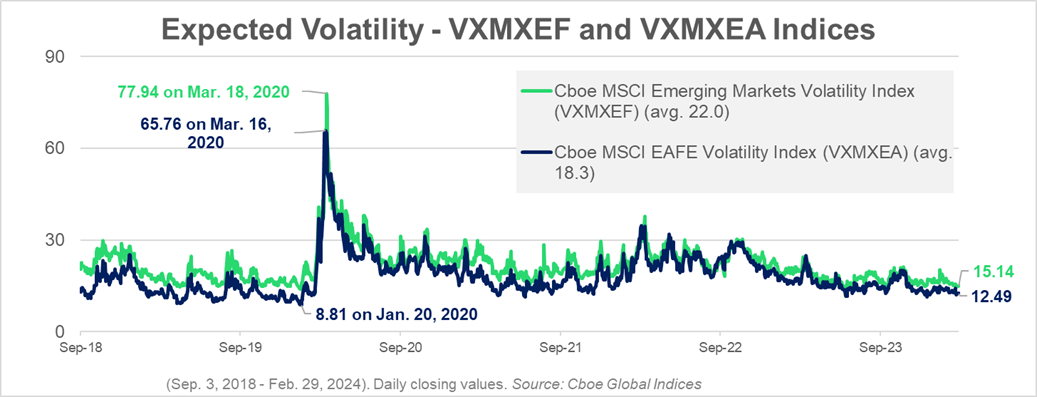
The charts below depict the expected volatility of The VXMXEF and VXMXEA and 30-day volatility for five MSCI indices. Highlights include:
The VXMXEA Index had gains of more than 30% on seven days between August 2018 and March 2024. On all seven dates MXEA, the corresponding stock index, experienced declines ranging from 0.9% down to 10.4% down.
On February 24, 2020, when uncertainties and fears about Covid-19 were increasing the MSCI EAFE Index (MXEA) fell 2.4%, and the MSCI ACWI Index (MXACW) fell 3%. At the same time, the VXMXEA Index rose 45.9% and VXMXEF Index rose 29.2%.
When a stock index experiences downward moves, there is a possibility that expected volatility and the corresponding volatility index might experience a sharp rise. Some volatility indices have experienced some large moves, convexity in returns and negative correlations versus the returns of the underlying stock indices.
The two volatility skew charts for MXEA and MXEF options show that the estimated implied volatilities were often much higher for the out-of-the-money (OTM) puts when compared to many of the OTM call options. OTM index option puts are bought for portfolio protection. Some OTM index option puts have been richly priced with higher implied volatilities in much of the time since October 1987.
Source: pro.livevol.com
Learn more about Cboe Indices and Strategies:
++++++++++++++++++++
There are important risks associated with transacting in any of the Cboe Company products or any digital assets discussed here. Before engaging in any transactions in those products or digital assets, it is important for market participants to carefully review the disclosures and disclaimers contained at: https://www.cboe.com/us_disclaimers/. These products and digital assets are complex and are suitable only for sophisticated market participants. These products involve the risk of loss, which can be substantial and, depending on the type of product, can exceed the amount of money deposited in establishing the position. Market participants should put at risk only funds that they can afford to lose without affecting their lifestyle. © 2024 Cboe Exchange, Inc. All Rights Reserved.

