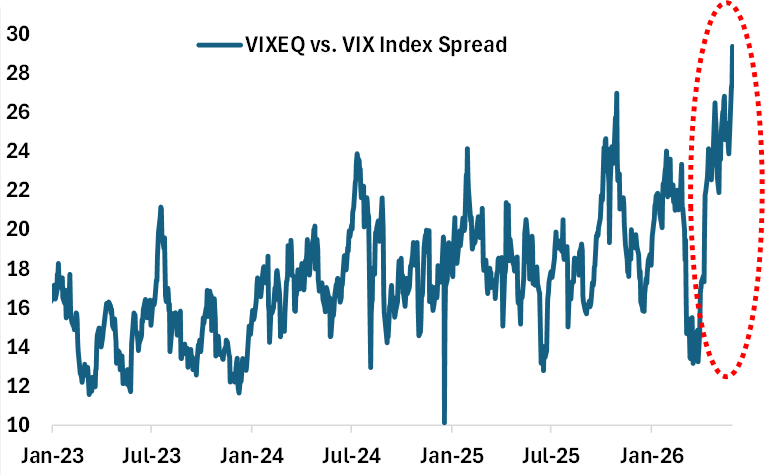
While macro volatility has fallen, single stock volatility has not. Average single stock volatility, as measured by the VIXEQSM Index, jumped over 4 pts last week to near a 1-year high of 45% (vs. the VIX Index which fell 1.4 pts to near a YTD low of 15.8%). The reason higher stock volatility hasn’t translated into higher index volatility is due to historically low correlation levels. Stocks are moving, but because they’re moving in different directions due to idiosyncratic risk factors (e.g. earnings, AI, etc), index volatility has remained muted. The spread between single stock vs. index volatility surged to a record high of 29 pts last week (see chart below).
Demand for single stock optionality has concentrated primarily in calls, with the equity put/call ratio hitting their lowest outside of 2021 “meme stock” and late 90s Tech Bubble extremes. A record 35% of stocks in the S&P top 100 now trade with inverted 3-month call skew. At the sector level, this is most concentrated in Tech & Energy. Ahead of the much anticipated SPCX IPO, retail optimism in Tech is reaching a near record, with bullish trades making up almost two-thirds of all retail opening options activity in the mega-cap Tech stocks (e.g. buying calls or selling puts to open).
With inflation back in focus, it’s not surprising that equity-bond correlation has broken down. What’s notable, however, is the degree. The 1M rolling correlation between the SPX® Index and the 10Y Treasury yield, at -87%, has fallen to the lowest on record going back to 1962. In other words, stocks and bonds are moving together (positive price return correlation) by the most on record – a challenge for anyone relying on fixed income for diversification.
Chart: Single Stock vs. Index Volatility Spread Surges to Record