While index volatility declined broadly last week, single stock volatility increased. This can be seen in the divergence between the VIX® Index and VIXEQSM Index. While the VIX Index fell by 1.0 pt, the VIXEQ Index (a measure of average single stock vol) gained almost 2 pts to 36%. As a result, the spread between the two widened from 18.5% to 21.6%. Higher bond yields have historically been a catalyst for increased stock dispersion, as different stocks/sectors have different interest rate sensitivities.
Risk sentiment turned more constructive in the options market, with skew flattening across all the major indices. SPX® 1M skew (25-delta ratio) declined from the 58th to 29th percentile low as investors sold out of hedges and rotated into calls. SPX 1M call skew increased to the 78th percentile high as a result.
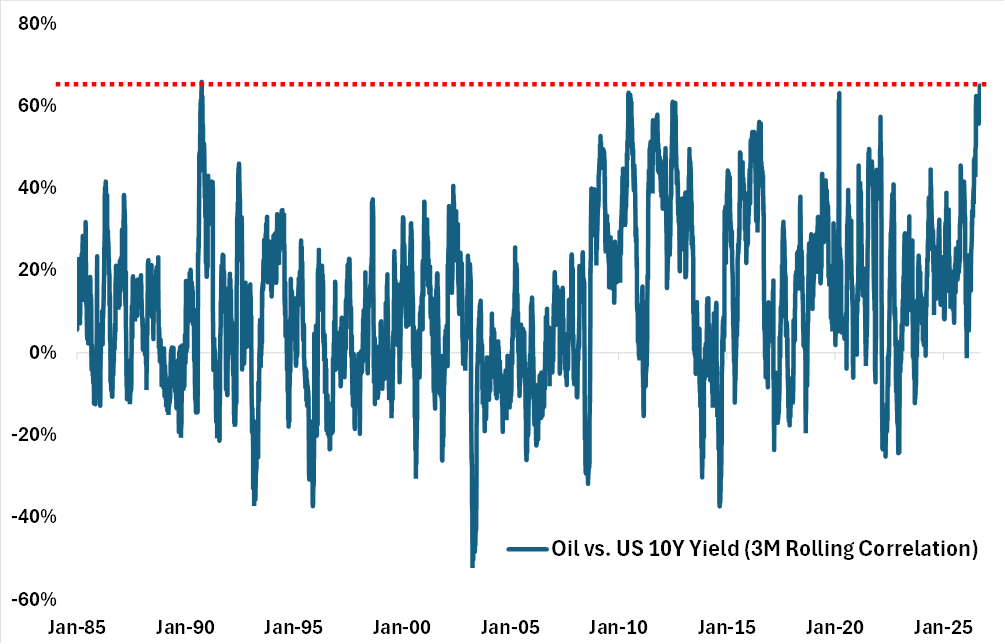
Cross-asset correlations have become more extreme in recent months. The most notable is the correlation between oil and interest rates which has jumped to a 35-year high. As seen in the chart below, the 3M rolling correlation between the US 10Y yield and WTI oil prices hit a high of 65% last week. That’s above the highs we saw during the depth of covid and the 2011 Arab Spring, and only slightly below the record high of 66% seen at the onset of the First Gulf War in 1990. If this pattern holds, then where yields go from here will be less dependent on the Fed and more on the situation in Iran.
Chart: US 10Y vs. Oil Correlation at a 35-Year High